What’s My Age Again?
Preschool Children’s Estimation of Absolute Age
Jessica R. Robins
Carnegie Mellon University
Abstract
This study assessed the maturation of children’s abilities to integrate numerical estimation and age discrimination skills in the context of estimating age. In order to do this, children from the 3-year-old, 4-year-old, and kindergarten classrooms of the Children’s School of Carnegie Mellon were presented with photographs of Caucasian men varying in age and asked to estimate their age. Results indicated that participant age and photograph age were both determinants of accuracy. Children used their own age as well as their parents’ age as representative anchors when determining the ages of others. As children got older, they accumulated more reference points and so became more accurate at estimating age.
Introduction
There are several different methods used to categorize and define the evolution of children’s mathematical abilities. One such category is estimation—children’s ability to guess at an unknown. Estimation skills can be measured in various ways, such as asking children to guess at the number of beans in a jar, find the position of a number on a number line, or estimate the ages of people in pictures. The last task requires not only knowledge about numbers but knowledge about people as well. Thus, proficiency at estimating age is due to two wholly distinct factors: the ability to discriminate between two people of different ages and the ability to accurately assign a numerical quantity to an unknown.
Much research has been conducted on preschoolers’ abilities to discriminate between people of different ages. All of these studies involved giving children two or more pictures and then asking them to sort them by age (e.g., Britton and Britton 1969a, 1969b; Looft 1971). Britton and Britton found that only 4 percent of the preschool sample could successfully sort the drawings, while Looft found that 40 percent of three-year-olds could choose the older looking drawing, and only 81 percent of nine-year-olds could. These experiments both showed poor age judgment performance; however, both experiments used drawings, which were more unrealistic and potentially more difficult to judge than photographs.
Several studies tested the results of Britton and Britton (1969a, 1969b), and Looft (1971), using photographs instead of drawings. These studies showed much better results for preschoolers. In one experiment, most four-year-olds were able to successfully rank sets of photographs in age order most of the time (Jones & Smith, 1983). Kogan, Stephans, and Shelton (1961) showed a substantial increase in the ability to discriminate between the ages of four and five. According to their results, the performance of five-year-olds was significantly close to the performance of adults. George, Hole, and Scaife (2000) also found considerable growth between the fourth and sixth years. In their study, 99 percent of six-year-olds, but only 36 percent of four-year-olds, could reliably decide which was the older of two faces. Thus it appeared that children improved significantly in their ability to distinguish between people of differing ages as they themselves got older.
With respect to children’s abilities to estimate, research has not been conducted on the strategies used to estimate age in particular. However, experiments using other ways to measure estimation ability (number line tasks, etc…) found that until age 10, children had a logarithmic internal representation of the number line, rather than a linear one (Siegler & Opfer 2003). Others found that until third grade, children viewed numbers as ordinal instead of rational (Petitto 1990). These results indicated an increase of estimation ability with age as children learned to represent numbers linearly. Siegler and Booth postulated that this improvement in estimation was due to improvement in counting ability (2005). In many kindergarten and 4-year-old classrooms, children practice counting daily. Thus, kindergarteners have more practice than 4-year-olds, who have more practice than 3-year-olds, who have almost no practice at all. Consequently we can expect kindergarteners to perform better than 4-year-olds, who will perform better than 3-year-olds, on estimation tasks, including the estimation of age.
Integrating the two ideas that both age discrimination and estimation skills mature with age, we can examine the way that children assign age estimates to photographs. There are three strategies, called judgmental heuristics, which adults employ in the estimation of age. Judgmental heuristics are defined as mental shortcuts that people use in order to make quick judgments. Jacobs and Potenza (1991) found that the likelihood of using heuristics increased significantly with grade level. They found that younger children were much less likely to use a consistent rationale and instead use individualized strategies such as personal preference.
The three distinct types judgmental heuristics are the availability heuristic, the anchoring and adjustment heuristic, and the representativeness heuristic. Contrary to the findings of Jacobs and Potenza (1991), many studies found that children did, in fact, use these heuristics when making quick judgments. The availability heuristic used available information to come to a conclusion. Several studies found that older preschoolers used the availability heuristic in order to determine the relative age of adults, using information such as face shape, wrinkles, gray hair, and baldness (Montpare & McArthur, 1986; Edwards, 1984).
The anchoring and adjustment heuristic used a number as a starting point and then adjusted up or down, usually insufficiently. A study by Smith (1999) found that children used the anchoring and adjustment heuristic when making estimates of numbers. This study also found that children had the tendency to over-adjust, yielding higher estimates. On the other hand, it was possible that because children between the ages of three and six did not often encounter large numbers, using the anchoring and adjustment heuristic caused them to underestimate the ages of adults. This would occur when the anchor used was consistently too small and adjustment was insufficient. Children might be more likely to use smaller numbers, such as their own age, as anchoring factors because of their prevalence in the child’s environment. This would cause adult ages to be reliably underestimated when the ages of children were fairly accurately estimated.
The representativeness heuristic measures how close an unknown is to a typical case (e.g., if a person looks like the subject’s mother, or grandmother, or sibling). In addition to being able to use themselves as a representative, children may have many more examples of people nearer to their age, such as classmates or siblings. Pairing the representativeness heuristic and the anchoring and adjustment heuristic, it is possible that, in estimating the ages of others, children will use themselves as a representative anchor and thus be most accurate at guessing the ages of children around the same age as them, underestimate the ages of older people, and overestimate the ages of younger children.
Children will still be more accurate at estimating the ages of people around their own age and younger because overestimation of younger ages will not be as severe as underestimation of adults’ ages. When estimating the ages of people younger than themselves, children use their own age as an anchor and adjust down, insufficiently, as per the anchoring and adjustment heuristic. However, because the children are young to begin with, there is not as large of a difference between their age and the age of the younger photographs as there is between their age and the older photographs. Thus it is possible to get much larger errors with adult ages. Additionally, children have more examples of children their own age (e.g., classmates and siblings) to draw on when determining the photograph is a certain age. This, also, would cause them to be more accurate at estimating the ages of children around their own age.
Several studies tested this effect and determined that children were, in fact, more accurate at discriminating between the ages of other children. According to Britton and Britton (1969b), children combined “all persons past the young adult level into one big category,” (p. 459) thus making it more difficult to discriminate between the ages of adults. George et al. (2000) found that 81 percent of four-year-olds could select the older photograph between a one to two year old and a five to ten year old, but only 47 percent could correctly discriminate between a photograph of a 65 to 70 year old and a photograph of a 75 to 80 year old. This effect was the same for the six-year-olds: 95 percent could discriminate between a one to two year old and a five to ten year old, 92 percent between a five to ten year old and a 15 to 20 year old, but only 75 percent could correctly judge the difference between adult faces. Thus it was much easier for children to discriminate between ages that were close to their own than it was for them to discriminate between older ages.
The purpose of this study was to determine the effect of participant age on absolute age judgments of strangers. Consequently, we hypothesized that (a) children will be better at estimating the ages of people closer in age to themselves, (b) children will underestimate the ages of adults and overestimate the age of children, and (c) children’s abilities to provide estimates of absolute age will increase with their own age.
This experiment was intended to contribute to the field of child development in two ways: add to the knowledge of children’s estimation and age discrimination skills and, uniquely, shed light on the maturation of their abilities to combine those two dissimilar skills in order to estimate age. No major studies have been conducted on the way children estimate the ages of strangers, and so this study was intended to increase the knowledge of the way children think about age as an absolute, rather than relative, quantity and to determine what strategies, if any, children use in order to perform this task.
Method
Participants
The participants were 30 children between the ages three and six recruited from the Children’s School at Carnegie Mellon. There were nine children from the 3-year-old classroom, 10 children from the 4-year-old classroom, and 11 children from the kindergarten classroom. All children participated in all conditions. Two participants were dropped—one from the 4-year-old classroom and one from kindergarten classroom—due to lack of estimates for a majority of photographs. Three total missing estimates were imputed for two participants from the kindergarten classroom by inputting the average estimate among the kindergarteners for that photograph age.
Materials
Fifteen color photographs of faces were selected from the Face and Gesture Recognition Research Network (FG-NET) Aging Database to be used as stimuli. Faces were of the following years of age: 1, 2, 4, 6, 8, 10, 12, 16, 19, 21, 28, 34, 43, 50, and 63. The faces were all Caucasian and male so as to minimize confounds. A pilot study was conducted on adults to verify that the photographs accurately represented a person of that age. Approximately five adults were shown each photograph and asked to guess the age. These guesses were within 10 percent of the age, which was regarded as sufficiently accurate.
Design
This experiment utilized a 3 (age of participant) x 15 (age of photograph) mixed between/within subjects design. The first factor, age of participant, had three levels: three, four, and five years old. The second factor, age of photograph, was a within-subjects variable and had 15 levels: 1, 2, 4, 6, 8, 10, 12, 16, 19, 21, 28, 34, 43, 50, and 63 years old. The independent variables in this study were the age of the subject and age of the face in the photograph. The dependent variables included the age each subject assigned to each photograph as well as the accuracy of their estimation, both absolute and as a fraction of the photograph’s true age.
Procedure
Testing occurred in one session in which participants were shown one photograph at a time and asked to guess the age of the person in the photograph. Children were shown the photographs on a 14-inch computer screen with a black background. The images were shown full screen with height as the limiting factor and not stretched. Nothing else (e.g., photograph number) was present on the computer screen at the time. Each child saw the photographs in a uniquely determined randomized order. For a subset of the photographs, after the participants estimated an age, they were asked how they chose that age. Participants were told that the purpose of this study was to find out how well children estimated ages and what clues they used to do so.
Results
In order to categorically explain the data, the results were split into two sections: accuracy of estimates and pattern of estimates. The accuracy of estimates parameters was used to test the hypothesis that older children would give estimations closer to the actual age than younger children. They were also used to determine which ages children were better at estimating, overall. The pattern of estimates parameters was used to assess the hypothesis that children overestimate young ages and underestimate older ages. An alpha level of .05 was used for all statistical tests.
The data for the 3-year-olds were omitted from the quantitative statistical analyses. We found that the 3-year-olds were seldom able to provide numerical age information about the photographs. When age estimates were given, only two participants were able to give estimates over 10, and only one gave estimates over 15.
Accuracy of Estimates
The accuracy of children’s estimates was assessed using a measure called the absolute error (AE) and was calculated by taking the absolute value of the difference between the actual age of the person in the photograph and the child’s estimation. For example, if the photographical age was 16 and the child estimated the age to be 11, the absolute error was five.
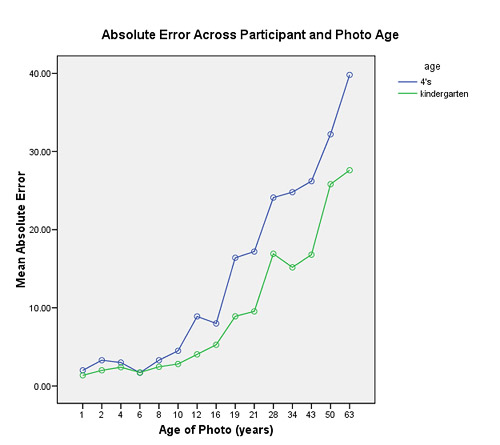
In order to assess accuracy, we performed a 2 x 15 (participant age by photo age) repeated measures ANOVA on the absolute error data. There was a significant main effect of photograph age F (1,19)=166, p<.05). This indicated that average error increased with increasing photo age (see Table 1, Figure 1). In other words, on average, the younger the age to estimate, the better children were at estimating it when absolute error was used as the measure of accuracy. Overall, children were most accurate at estimating the ages of one-year-olds and six-year-olds. In addition, there was a significant main effect of age of participant (4-year-olds versus kindergarteners) F (1,19)=18.8, p<.05). The mean error for the kindergarteners was 9.52 (SD=.77) whereas the mean error for the 4-year-olds was 14.4 (SD=.81). Kindergarteners were significantly more accurate than 4-year-olds in this case. The results also indicated a significant interaction between the age of the photograph and the age of the participant F (1,19)=5.46, p<.05). This means that participant age had a significant effect on the way the photograph age affected accuracy. As illustrated in Figure 1, difference in accuracy between 4-year-olds and kindergarteners is small for the smaller photograph ages and larger for the older photographs.
Table 1: Mean Absolute Error across Photo Age and Participant Age
4-year-olds
Kindergarteners
Total
1
2.00
1.36
1.67
2
3.30
2.00
2.61
4
3.00
2.40
2.69
6
1.70
1.73
1.71
8
3.30
2.45
2.86
10
4.50
2.82
3.62
12
8.90
4.05
6.36
16
8.00
5.28
6.57
19
16.4
8.91
12.5
21
17.2
9.55
13.2
28
24.1
16.9
20.3
34
24.8
15.2
19.8
43
26.2
16.8
21.3
50
32.2
25.8
28.9
63
39.8
27.6
33.4
Figure 1: Graph of Mean Absolute Error across Photo and Participant Age
Pattern of Estimates
A measure called the ratio error (RE) was used to determine the pattern of children’s estimates; it was calculated for each age by dividing the child’s estimate by the correct age. In this way, we were able to assess the ages children underestimated and overestimated, on average. If the RE was less than one, the estimate was less than the actual age, and if the RE was greater than one, the estimate was greater than the actual age. If the RE was exactly one, the child estimated correctly.
We performed a 2 x 15 (age of participant by age of photograph) repeated measures ANOVA on the ratio error data. We found that overall, children seemed to overestimate the younger ages and underestimate the older ages. They were most accurate at estimating the ages of six-year-olds, 21-year-olds, and 28-year-olds (see Table 2, Figure 2). The ANOVA results indicated a significant main effect of age of photograph in this case F (1,19)=7.16, p<.05). Using this measure, we have insufficient information to conclude that children’s accuracy increases with the age to be estimated; however, we can infer that the pattern of under- and overestimation found in the descriptive statistics was significant. Neither the main effect of participant age nor the interaction between participant and photograph age was significant with F (1,19)=.04, p=.84 and F (1,19)=.25, p=.62 respectively.
Table 2: Relative Error across Age of Participant and Photograph
4-year-olds
Kindergarteners
Total
1
2.80
2.36
2.57
2
2.45
2.00
2.21
4
1.25
1.50
1.38
6
1.02
1.11
1.06
8
0.84
0.88
0.86
10
0.95
0.94
0.94
12
1.13
0.78
0.95
16
0.59
1.09
0.85
19
1.17
1.39
1.29
21
1.03
1.14
1.09
28
1.13
0.99
1.06
34
0.84
0.61
0.72
43
0.79
0.77
0.78
50
0.36
1.03
0.71
63
0.66
0.91
0.79
Figure 2: Graph of Relative Error across Age of Participant and Photograph
.
Discussion
This experiment was designed to study the effect of age of participants on their ability to judge the ages of photographs of different ages. Participants in 3-year-old, 4-year-old, and kindergarten classrooms were asked to estimate the ages of 15 photographs of Caucasian males. We hypothesized that (a) older children would be more accurate at estimating the ages of photographs overall, (b) children would be more accurate at estimating the ages of photographs close in age to themselves, and (c) children would overestimate younger ages and underestimate older ages. These hypotheses all stem from the idea that children use themselves as an anchor—a representation of a known age—from which to adjust either up or down when estimating unknown ages.
Accuracy of Estimations
Overall, kindergarteners were significantly more accurate than 4-year-olds. The data for the 3-year-olds were not included due to their lack of ability to provide numerical estimations. The large majority of 3-year-olds were only able to provide “older than me” or “younger than me” responses. Because of this, we concluded that both 4-year-olds and kindergarteners do significantly better than 3-year-olds at providing numerical estimations. In fact, this indicated that the ability to estimate numbers arises between the ages of three and four, after which estimation skills continue to be refined. The emergence of estimation may coincide with a sudden increase of mathematical ability or training (e.g., learning to count and name numbers greater than 10) between three and four years old. Siegler and Booth (2005) postulated that this significant improvement in estimation skills might be due to improvements in counting strategies. This was supported by the fact that in most 4-year-old and kindergarten classrooms, children often practice counting by 1’s, 5’s, or 10’s every day. Children in 3-year-old classrooms do not usually get such rigorous mathematical training.
Children were, on average, most accurate at estimating ages below and including eight-year-olds. In particular, they were most accurate at estimating the ages of six-year-olds and one-year-olds. Accuracy got significantly worse as the age of the photograph increased. This confirmed the hypothesis that children are better at estimating the ages of other children. This result is supported by the finding of Britton and Britton (1969b) that it was more difficult for children to discriminate between the ages of adults because, to children, adults are lumped into one big category.
Additionally, the distribution of errors resembled a logarithmic distribution. This was consistent with the notion that children represent the number line logarithmically until approximately fourth grade (Siegler & Opfer 2003). In other words, children view distances between larger numbers as larger than distances between smaller numbers and so it would make sense that they also view the distances between larger ages as larger than the distance between smaller ages. In fact, Petito (1990) postulated that until third grade, children viewed numbers as ordinal rather than rational and so had no concept of the magnitude of the distance between two numbers. This implied that children would only be able to estimate ages of which they had prior knowledge and would not be able to accurately extrapolate up or down. In other words, children were accurate at estimating the ages for which they developed a mental representation but were unable to use those representations to estimate other ages because they were unable to determine the magnitude of the distances between ages.
Pattern of Estimates
The pattern of children’s estimates was assessed using the ratio measure. We found that the age of the photograph had a significant effect on children’s estimates, meaning that there were some ages that children consistently overestimated and some that they consistently underestimated. Overall, they overestimated the ages until about age six, underestimated between six and 16, overestimated between 16 and 28, and underestimated the ages after about age 28. Although we expected children to be accurate at around their own age, we did not expect the second rise in accuracy. It is possible that this was due to the use of a second reference point: their parents’ ages, in addition to their own age. Their estimates might be explained by breaking the ages into categories: younger than me, around the same age as me, older than me, younger than my parents, around the same age as my parents, older than my parents. When broken up in this way, children overestimated both categories in which the photographs were younger than someone. They were most accurate at guessing the ages of people that were around the same age as them or their parents, and they underestimated the ages that were either older than them, or older than their parents. This provided evidence that children might actually have two frames of reference, or anchors, when judging age. It is possible that children estimate age more accurately as they get older not only because of improved numerical aptitude but also due to the increased number of reference points they have. This may be because of new siblings, new older friends, or just people they already know (themselves included) getting older. These new points of reference may be additive, which allows them to estimate successfully the ages they already knew as well as the new age references that they acquire.
Although the results resembled the results we expected, this experiment could have benefited from more participants. There were some photograph age results that were heavily skewed by outlier data (e.g., a child estimating 16 years for the one-year-old). Using more participants would have more effectively balanced out the outliers. More participants would also allow for explorations into participant gender effects. This experiment did not take gender effects into account because, at the most, there would have been five girls and five boys in each group. With that few participants per condition, there would not have been enough power to get significant results.
The other gender effect we did not take into account was the gender of the photograph. Another experiment could be done to test the accuracy of children’s estimation of female ages. This effect was not tested in our experiment because adding another gender would mean twice as many photographs to show each child. We decided to sacrifice generalizability in order to be able to show each child a wider range of ages. Other experiments could either only use female photographs, or narrow down the number of photographs to a smaller set of essential ages.
Narrowing the set of ages may be helpful in and of itself because there were significant testing effects using 15 photographs. The children seemed to get tired or bored by around the 10 th picture. Although randomizing the order of the photographs shown minimized the effect this had on our data, better data would still be gained by either lowering the number of photographs or making the experiment more interesting and engaging in some way.
In summary, the results of this experiment supported all three of our main hypotheses. The ability to make estimations emerged between the ages of three and four and, in addition, older children were more accurate at estimating than younger children. Children also were most accurate at estimating the ages of photographs their own age and younger. In addition to supporting the hypothesis that when children used themselves as reference points, they underestimated people who were younger and overestimated people who were older, we also found that children used their parents’ ages as a reference point and that the same pattern applied. As children become older, they mature both in their ability to estimate and their ability to discriminate between different ages. It is possible this is due to the increased number of reference points they accumulate.
References
Britton, J. O., & Britton, J. H. (1969a). Discrimination and perception of age and aging by elementary school children. Proceedings of the 77 th Annual Convention of the American Psychological Association, 4, 715-716.
Britton, J. O., & Britton, J. H. (1969b). Discrimination of age by preschool children. Journal of Gerontology, 24, 457-460.
Edwards, C. (1984). The age group labels and categories of preschool children. Child Development, 55, 440-452.
FG-NET Aging Database . (n.d.). Retrieved February 25, 2008, from http://www.fgnet.rsunit.com/.
George, P., Hole, G., & Scaife, M. (2000). Factors influencing young children's ability to discriminate unfamiliar faces by age. International Journal of Behavioral Development, 24(4), 480-491.
Jacobs, J., & Potenza, M. (1991). The use of judgment heuristics to make social and object decisions: A developmental perspective. Child Development, 62, 166-178.
Jones, G., & Smith, P. (1983). The eyes have it: Young children’s discrimination of age in masked and unmasked facial photographs. Journal of Experimental Child Psychology, 38(2), 328-337.
Kogan, N., Stephens, J., & Shelton, F. (1961). Age differences: A developmental study of discriminability and affective response. Journal of Abnormal and Social Psychology, 62(2), 221-230.
Kratochwill, T., & Goldman, J. (1973). Developmental changes in children’s judgments of age. Developmental Psychology, 9(3), 358-362.
Looft, W. (1971). Children’s judgments of age. Child Development, 42(4), 1282-1284.
Montpare, J., & McArthur, L. (1986). The influence of facial characteristics on children’s age perceptions. Journal of Experimental Child Psychology, 42(3), 303-314.
Petitto, A. L. (1990). Development of numberline and measurement concepts. Cognition and Instruction, 7, 55-78.
Siegler, R., & Opfer, J. (2003). The development of numerical estimation: evidence for multiple representations of numerical quantity. Psychological Science, 14(3), 237-243.
Siegler, R. S., & Booth, J. L. (2005). Development of numerical estimation: A review. In J. I. D. Campbell (Ed.), Handbook of mathematical cognition (pp. 197-212). New York: Psychology Press.
Smith, D. (1999). Use of the anchoring and adjustment heuristic by children. Current Psychology: Developmental - Learning - Personality - Social, 18(3), 294-300.
Taylor, E., Steele, C., & Roberto, K. (1982). Preschool children’s discrimination of age. Perception and Motor Skills, 54(2), 539-542.
|