Statistical Analysis of Quality of Life in A Heart Clinical Trial
Jennifer Ferrell
University of Louisville
Abstract
The purpose of this research project is to use different statistical models to examine relationships of data in a clinical trial at the University of Louisville. The data include demographic variables, treatment variables, clinical measurements, and quality of life data. Through different techniques, we will try to discern how quality of life will be improved over time with the implantation of the pacemaker. The different techniques we will use include linear models, tests for categorical data, and kernel density estimation. By using these techniques, we will show the effectiveness of pacemakers and implantable cardioverter defibrillator (ICD) on patients� health over time. The use of ICDs and pacemakers may be more beneficial to patients than first thought. Through analyzing the data, we will be able to determine if the overall quality of life improves with time.
Introduction
The purpose of this study is to analyze groups of data pertaining to the placement and effectiveness of pacemakers in patients. This study will show if pacemakers and implantable cardioverter defibrillators (ICD) on the right atrial appendage (RAA) or atrial septum (RAS) will reduce atrial fibrillation, irregular heartbeat caused by abnormal electrical activity of the heart, and overall improve the quality of life over time. This study examines the change, if any, in the overall quality of life over an 18-month time period.
By using the SAS system (SAS Institute, Inc.; Cary, NC) we will show the importance of the study through the analysis of patient demographics and quality of life surveys. Different tests such as summary statistics, frequency counts, chi-square tests, linear models, and density graphs will be used to help understand the data. Through these tests, we will study how pacemakers and implantable cardioverter defibrillators (ICD) in patients will improve the quality of life.
Background
This study will show if placement of pacemakers and ICD�s on the right atrial appendage (RAA) or atrial septum (RAS) (shown in Figure 1) will reduce atrial fibrillation, irregular heartbeat caused by abnormal electrical activity of the heart, and overall improve the quality of life over time. The atrial appendages are blind pouches connected to the right and left atrium. These pouches have no known useful function. As the heart contracts, the appendages contract as well for blood flow in and out of the atrial muscle and appendages. The blood does not move in and out during atrial fibrillation. This does not
Figure 1 - Heart Diagram ( http://www.cincinnatichildrens.org/health/heart-encyclopedia/intro/components.htm)
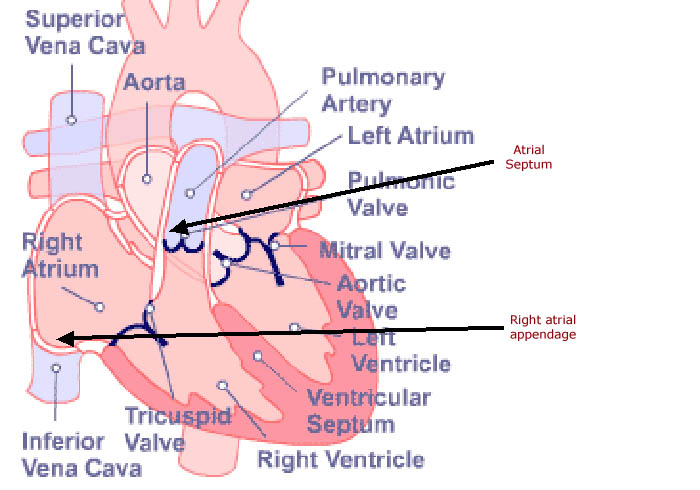
pose a big problem in the right atrial appendage (RAA), but causes significant problems in the left appendage. Since the blood is relatively still, clots form and usually grow fairly large. The atrial septum is the wall between the right and left atrium. Erratic electrical signals cause the upper chambers of the heart to beat irregularly and rapidly and may also cause the lower chambers of the heart to do the same. Atrial fibrillation can affect blood flow to the heart and to the rest of the body. In order to regulate the electrical signals, pacemakers and Implantable Cardioverter Defibrillators (ICDs) are used as lifesaving devices. A pacemaker is a small battery-powered device containing a tiny computer. It is used to monitor the natural heart rate. When the onset of atrial fibrillation occurs, the pacemaker sends electrical signals to the heart to regulate the blood flow. ICDs are also small battery-powered devices containing a tiny computer used to monitor heart rates. The difference between pacemakers and ICDS is that when atrial fibrillation begins in a patient with an ICD, the ICD system determines if the heart needs to be treated. If this is the case, preset therapy programmed by the doctor will deliver what is needed. If the heart needs to speed up, then ICD acts like a pacemaker and sends electrical signals to help the heart. If the heart is beating too rapidly, the ICD delivers the therapy needed to slow it down. Depending on the patients� conditions, the supervising physician will prescribe the proper heart monitor. This study will show if alternate pacing sites of the pacemakers or ICDs can improve the overall quality of life.Methods
A technique often used in statistics is linear models, or analysis of variables (ANOVA). In the study, ANOVA is used to compare a dependent variable to other independent variables. This process can be used to show the change of a data set over a period of time, such as a Quality of Life comparison. ANOVA tests the differences in the data sets or means for statistical significance.
Kernel Density is a test commonly used to test the data sample to make sure it is large enough and follows a normal distribution by approximating a hypothesized probability density function from the observed data. Kernel Density is a nonparametric technique in which a known density function is averaged across the observed data points to create a smooth approximation. The equation is shown below:
Where
n=sample size
K=known density function
Hn=bandwidth, controls the level of smoothing in the estimator.
ResultsThe basis of this study is to analyze patient demographics and survey results to find if the patients are overall improving their quality of life by using these devices. Currently, there are 34 patients with ICD�s and 67 patients with pacemakers enrolled in the study. As expected, the frequency of randomized lead placement of RAA and RAS is almost even at 50% and 51% respectively by pacemaker and ICD. The gender however, was 69% male and only 32% female. Patients were 70.87 � 13.96 years old on the average (range 30-101).
Linear Models
Using the gender, randomize lead placement and type of device variables, a linear model was used to determine the significance of each variable when compared to the age of the patients. Only the type of device used was significant in this model. The Pr>F value was 0.0072. The Ryan-Einot-Gabrial-Welsch Multiple Range Test for Age was then used to determine error rate. The data are shown in the tables 1 and 2. From this test, it can be concluded that overall, patients who use pacemakers are older than those who use ICDs.
Table 1 Ryan-Einot-Gabrial-Welsch Multiple Range Test for Age
Alpha
0.05
Error Degrees of Freedom
97
Error Mean Square
184.23
Harmonic Mean of Cell Sizes
45.109
Table 2
Ryan-Einot-Gabrial-Welsch Multiple Range Test for Age
REGWQ Grouping
Mean
N
Type of Device
A
73.299
67
Pacemaker
B
65.794
34
ICD
Density Graph
Using the SAS editor, a program was written to determine the density of age by gender. The SAS programming code used was;
proc kde data=sasuser_lessAF gridl=40 gridu=100 out=outkde;
var age;
by gender;
run;
The result is shown in figure 2. Note that females are generally older compared to males. One interesting note is the small bump in the female line around the age of 40. This normally is an early age for heart problems and may be a side effect of other problems such as artificial menopause i.e., hysterectomies. This is merely a hypothesis and a concern that will need to be researched more.
Figure 2 - Density of Age by Gender
�
Quality of LifeWhen conducting any study involving patients, the quality of life plays a significant role in patient outcomes. The patients overall quality of life should not decrease and actually should increase. In this study, patients were given quality of life surveys each visit to see if they were overall improving. Chi-Square tests were conducted on all survey questions to see if there were any significance. Linear models were then conducted on the questions with numerical significance to observe the changes made from visit to visit. These are shown in Table 3.�
Table 3 Quality of Life Linear Models
Form Type
2 Week
3 Month
6 Month
12 Month
Chi Square
Bathing Self
0.7352
2.6176
2.7567
2.7439
0.0015
Bodily Pain
0.9363
2.8038
2.8247
2.6782
0.0302
General Health Now
0.5055
2.7982
2.8845
2.8715
<.0001
Moderate Activities
0.7582
0.7582
2.1063
2.2196
0.0027
Lifting/Carrying Groceries
0.6068
2.2431
2.1745
2.0151
0.0052
Climbing Several Stairs
0.454
1.7814
1.7511
1.971
0.0007
Climbing one Flight
0.6843
2.1745
2.2403
2.303
0.0225
Walking more than one mile
0.4786
1.6602
1.7425
1.4688
<.0001
Walking Several Blocks
0.6682
1.8529
1.8572
1.8552
0.0042
Walking One Block
0.6763
2.2812
2.1556
2.0656
0.0043
Interfered Socially
0.9348
2.3436
2.3698
2.299
0.0005
Pain Interfered
0.7755
2.306
2.2896
2.2466
<.0001
Full of Pep
1.3459
4.236
4.3715
4.1198
0.004
Felt Down in the Dumps
1.5238
4.7936
4.8469
4.1548
0.0232
Felt Peaceful
1.1135
3.2937
3.2657
3.2162
0.0129
Have Lots of Energy
1.3517
4.3447
4.3369
4.0914
0.0057
I am a Happy Person
0.8445
2.6354
2.7271
3.0466
<.0001
I Get Sick Easier
0.9424
3.6119
3.7257
4.1699
0.0415
Shown in figures 3 and 4 are comparisons of general health now, I am a happy person, moderate activities, and bodily pain; and comparisons of everyday physical activities of walking one block, climbing a flight of stairs, bathing yourself, and I am full of pep. Overall the quality of life seems to be improving between the 2-week and 3-month visits. Although the improvements are minor, any improvement in the health and general well- being of patients is a hopeful sign for the future of these patients.
Figure 3 - Quality of Life Comparison 1
Figure 4 - Quality of Life Comparison 2, Physical Activities
Discussion
Based on the analysis conducted on the data, it is clearly shown that the use of the pacemakers and ICD�s are improving the overall quality of life.� The particular placement of these devices does not seem to make a differences but just the use of these seem to be helping. It is interesting to note the blip in the females on the age density graph. This raises the issue of younger women having heart attacks. An issue of this measure would simply need to be researched more in depth in a separate study to find possible conclusions of this matter.
|
|
|
©2002-2021 All rights reserved by the Undergraduate Research Community. |