Age and the Human Ability to Decode Words1
Sonya Davey
Thomas S. Wootton High School, Rockville, MD
Abstract
What is the age when reading fluency in a certain population begins? It is not only important to know the reading fluency starting age of individuals with learning disabilities in reading but also to compare reading fluency of students at one school versus another. Reading fluency is the ability to read text, not just accurately but also quickly and effortlessly. This study describes a method of determining a reading fluency starting age. Based upon the data obtained from the present research, it was determined that the reading fluency starting age was the age at which the reading fluency score on the alphabetical test versus ages of the population showed a maximum.
Background
Reading is the multi-dimensional cognitive process of decoding symbols for deriving meaning. In other words, reading is the ability to decode and comprehend text. The first aspect of reading is decoding; decoding speed is one indication of reading fluency.
Decoding involves the knowledge of individual sounds or phonemes (phonemic awareness), familiarity with the letters in the language (letter knowledge), and the knowledge that each letter corresponds with a specific sound (alphabetic principle). In order to bring clarity to these three steps, one can track the reading stages with the words “cat” and “hat.” In the phonemic awareness stage, a child recognizes various sounds through oral and verbal interactions. The child unconsciously recognizes the hard “c” sound before cat and the soft “h” sound before hat while listening and speaking. During the next stage of letter knowledge, a child learns the alphabet. In the last stage – alphabetic principle – the child combines the activities involved in the first two stages. The child recognizes that the letter “c” results in the hard “c” sound in the word “cat,” while the letter “h” results in the soft “h” sound in the word “hat.” The final act of decoding is using the alphabetic principal to decipher regular words (Teaching Phonics, n.d.). The above process outlines initial decoding—when a reader begins to slowly sound out words. Fluency in decoding, however, occurs when the reader has knowledge of larger units, allowing efficient reading without sounding out each letter. This knowledge allows automaticity, which is decoding without conscience attention; readers are able to recognize and comprehend the text simultaneously. This degree of fluency causes the readers to lose careful attention to specific letters (Rasinski, n.d.).
According to Chall’s research, there are five stages of reading development (Chall, n.d.). The first stage consists of pre-reading, which is oral and verbal development in the language. The second stage is logographic reading, which is the ability to recognize signs and visual patterns in text. The third stage is early alphabetic reading, which is sound and letter correspondence. The fourth stage consists of memory for sight words and decoding by analogy. The fifth stage, orthographic reading, is the ability to decode whole words. This is the stage where the reader is fluent at decoding.
The objectives of this study were:
- to formulate a model to determine a reading fluency starting age of a population;
- to validate the model; and
- to determine the reading fluency starting age of Indian students (whose mother tongue is not English) who study in English medium schools in India where all subjects other than the Indian languages are taught in English.
This study builds upon Chall’s five stages of reading development and the author’s prior research, in April 2007, entitled “Familiarity Breeds Contempt” to determine whether the familiarity of a language affects one’s ability to recognize certain characters (Davey & Thakur, 2007).
Method
The purpose of this study was to correlate age and the human ability to decode words. The following Research Questions were generated:
- Is there an age when a human population develops the ability to decode words?
- What should be the model and methodology to test the age when a human population develops the ability to decode words?
Method of Data Collection
The survey instrument used in this study evaluated the ability of a population of students in India of ages five to seventeen to determine the number of F’s in a text in English and the number of the Microsoft ® font Webdings symbol
corresponding to the alphabet F in the same text written in Webdings .
The research used two tests that contained the same texts – one in English and the other in Webdings. The following two tests were used in this research for determining a reading fluency starting age:
F Test : Find the number of F’s in the following text:
ALFRED FINDS THAT THE FRUIT OF HARD WORK IS ALWAYS SWEETER THAN TAKING THE CREDIT OF THE WORK OF ANOTHER.
Symbols Test : Find the number of
The population was tested at different ages on the F Test and the Symbols Test. The reading fluency was ranked on the alphabetical test versus ages of the population . The reading fluency starting age was determined to be the age at which the reading fluency score on the alphabetical test versus ages of the population showed a maximum.
The population was students between the age of five and seventeen, who attended to two English medium schools, Sadhana High School and Tupil School, in Ahmedabad, India. As the research was on human subjects, the author obtained prior permission from the Principals of these two schools to undertake the survey. The Principals reviewed the survey instrument and approved the survey because it did not require any student to identify himself/herself or provide any confidential information.
The survey instrument was personally distributed by the author. The students were tested in August 2008. Each student was tested on the F Test and the Symbols Test. In the F Test, students were given fifteen seconds to find the number of occurrences of the letter “F.” In the Symbols Test, students also had fifteen seconds to find the number of occurrences of the symbol
Due to the manner of the research, the materials for testing were limited to the two tests described above, the subjects to be tested, and a stopwatch. However, because human subjects were tested, adequate considerations for lack of cooperation, testing environment, prior experience in such tests, and educational background was needed. To account for these possible disparities, the sample size was very large – 472 students in all.
The variables in the research were quite straightforward. The independent variable was the age of the student and the dependent variable was student’s score on each test. Note that the scores for the F Test and the Symbols Test are independent of each other. For example, if a student recognizes four F’s, then the student receives a score of four out of the six total F’s present on the F Test. If that student recognizes all of the symbols, then the student receives a score of 6 out of 6 on the Symbols Test. The person taking both tests remained constant; therefore, intellect and other abilities are constant irrespective of whether the test-taker was taking the F Test or the Symbols Test. The control test for the research is the Symbols Test. The Symbols Test served as the control because all students have the same prior knowledge in reading the symbols (none of the students have fluency in this “language”), regardless of the age of the student.
The Spearman Rank Test was selected for the analysis of data of the F Test and the Symbols Test. The independent variable was the age of the student and the dependent variable was the number of letters and symbols spotted by the student.
Data Collection and Statistical Analysis
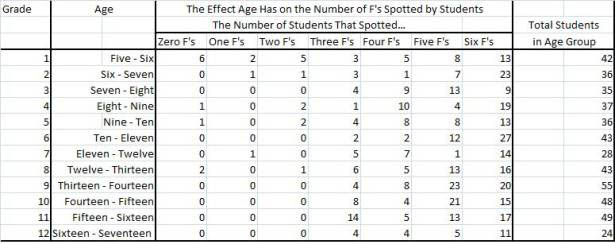
The age of each student tested was correlated with his/her score on the F Test as shown in Table 1.
Table 1: Correlation of the age of each student tested with his/her score on the F Test
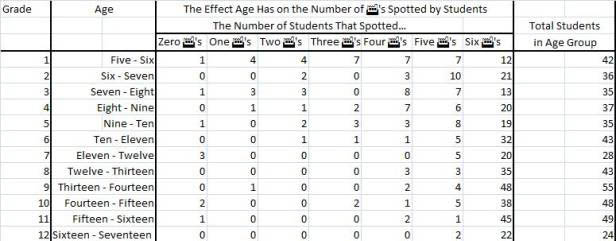
The age of each student tested was correlated with his/her score on the Symbols Test as shown Table 2.
Table 2: Correlation of the age of each student tested with his/her score on the Symbols Test
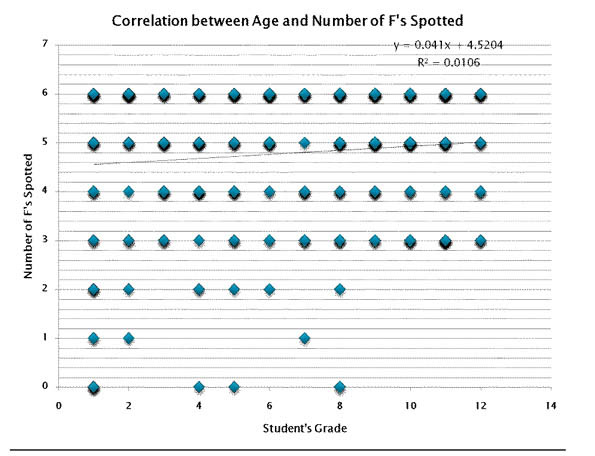
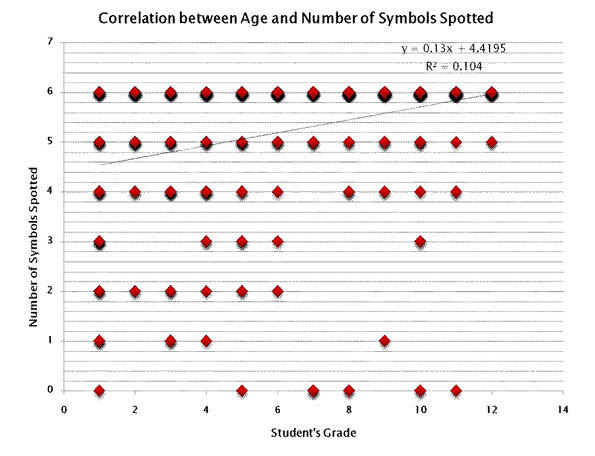
Fig. 1 and Fig. 2 show that the line of best fit for the correlation graph of the Symbols Test has a rate of change that is 9.5 times greater than that of the F Test (determined by the slopes of both lines.). This demonstates that the Symbols Test, which is the control test, has a far greater correlation between age and score, than the experimental F Test.
Figure 1: Plot of number of F spotted in the F Test as a function of the students’ grades.
Figure 2: Plot show number of symbols spotted the Symbols Test as a function of the students’ grades.
Fig. 1 shows that the data of the F Test are significant, as the p-value for the F Test data is less than 0.0001 or 0.01%. Fig. 2 shows that the data of the Symbols Test are significant, as the p-value for the Symbols Test data is less than 0.0001 or 0.01%. The sample size was 472 students, with at least 24 students in each age group. Both correlations were significant, as the p-values were less than 0.0001. Therefore, one can reject the null hypothesis that there is no correlation between the ages of the students and the number of F and symbols spotted by the students.
The data show a correlation between the performance of the F Test (ability to recognize letters) and the age of the participant, and there is a correlation between the performance of the Symbols Test (ability to recognize symbols) and the age of the participant. To understand the far lower rate of change for the graph of the F Test, the data were further analyzed and the percentage of students in each age group that earned a 6/6 on the F and Symbols Tests were plotted.
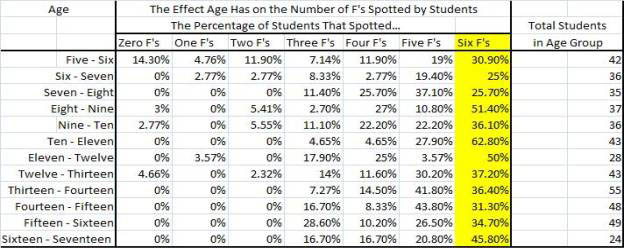
Table 3 and Table 4 display the percentage of students from each age group who earned a 6 out of 6 in the F Test and Symbols Test, respectively.
Table 3: Percentage of students from each group who earned a 6 out of 6 in the F Test
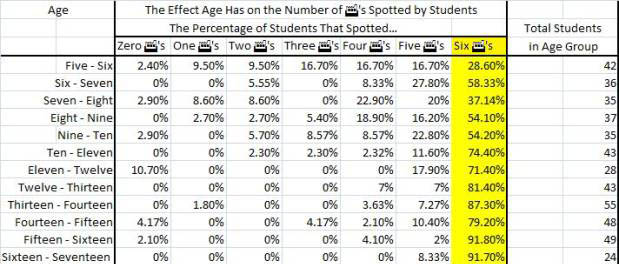
Table 4: Percentage of students who earned 6 out of 6 in the Symbols Test
This percentage of students who successfully completed the F Test and Symbols Test (i.e., earned the score of a six) was plotted versus the age group as shown in Fig. 3.
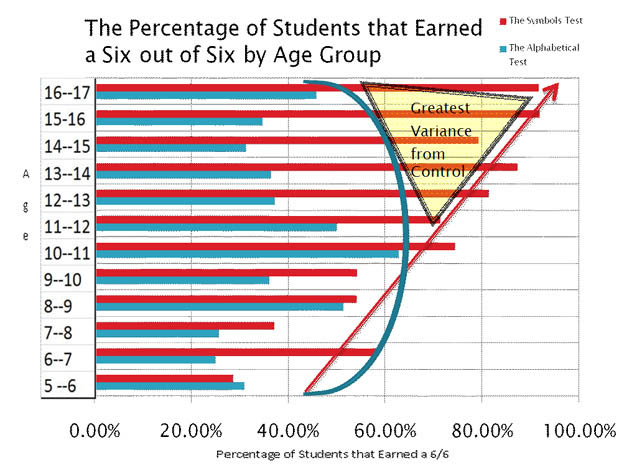
Figure 3 : Chart showing the percentage of students that earned 6 out of 6 in the F Test and the Symbols Test as a function of the ages of the students
A trend was found by comparing the percentage of students who earned a 6/6 by age group on both tests. On the control test (the Symbols Test) as students’ age increased, the percentage of students earning six out of six increased. There was a direct correlation. This direct correlation showed that as the student becomes older, he/she has better testing ability and is able take the test more efficiently. However, the experimental test (the F Test) depicted a variation from the control test. A parabolic trend exists, with the highest percent of students earning a six out of six between ages ten and eleven. Between ages ten and eleven, 62.80% of the students received a score of six out of six. After this age, there was a steady drop in the percentage of students who earned a 6/6. Perhaps this can be attributed to the maximum in the F Test curve to the start of reading fluency in English. The English reading fluency starting age of the population tested was between ages ten and eleven, when the reading fluency score on the F Test versus ages of the population was a maximum as shown in Fig. 3.
The study found that fluent English readers were able to recognize an indicated symbol from an unfamiliar language more easily than an indicated letter from the English language. During the English phrase test, individual English letters were a visual distraction because fluent readers read whole words at a time, and thereby did not recognize an indicated letter as easily. In the Webdings phrase test, however, because there was no fluency in the language, the decoding process did not occur automatically and an individual symbol was recognized and isolated.
Conclusion
The chart of Fig. 3 clearly displays that after age ten to eleven there is the greatest variance from the control Symbols Test. The F Test and the Symbols Test is a model to find the age at which fluency in a language begins to develop. Therefore, the data support that students in India who study at English medium schools begin to develop greatest fluency at decoding words between ages 11 and 12. This model is applicable to various different populations and different languages to determine the age when reading fluency develops with that particular population in a particular language. Further research is desirable on students in the United States and other countries. Through this research, it is now possible to determine the variations in reading fluency ages from one population to another. The results therefore may lead us to conclusions about the education of English in various countries and among different schools in the United States. The results could also be applicable for determining patterns of difficulties in students with reading disabilities.
1 Patent pending at the United States Patent and Trademark Office
References
Chall, J. (n.d.). Chall’s Stages of Reading Development. Available on May 9, 2009, at http://www2.scholastic.com/....pdf .
Davey S., & Thakur, H. (2007, April). Familiarity breeds contempt. Unpublished article.
Rasinski, T.V. (n.d.). Assessing Reading Fluency. Available on May 9, 2009, at http://www.prel.org/products/re_/assessing-fluency.htm.
Teaching Phonics in the National Literacy Strategy. (n.d.). Available on May 9, 2009, at http://www.standards.dfes.gov.uk/pdf/literacy/nls_phonics.pdf.

|