The "Growing" American Dream: An Analysis of Historic Trends in Housing
Erin Cammel
Kansas State University
Keywords: housing, growth, historic trends, American dream, American culture, culture, new construction
Abstract
The purpose of this paper is to compare data found in Small Homes of Architectural Distinction by the Architects' Small House Service Bureau in 1929 to U.S. Census data from 1930 and 1980 through 2010. In an attempt to explain the expansion of the American household, average square footage and number of bedrooms and bathrooms are correlated to average household size and income (U.S. Census Bureau, n.d., a.). All of these statistical categories have been impacted by the fluctuation of the American economy and cultural influences.
Introduction
The American household has seen many changes through the past century. Although the household has seen fluctuation, there is a general trend of larger homes. At the turn of the 20th century, the average single-family house was quite small by contemporary standards given that the average family size was more than four persons. Through the years, houses have become larger in square footage, number of bedrooms, and number of bathrooms while family size has been shrinking (U.S. Census Bureau, n.d., b).
American social and cultural views have changed over the years, sparking this phenomenon. Chung (2012) provided insight into the social and cultural changes that have precipitated American society. The growth in the size of single-family homes has had significant negative impacts on our sense of community among members of society. Homes are becoming a statement of household wealth. Homes of substantial size have become so excessive that they have to be built as commercial construction because regular residential construction cannot support them (Chung, 2012). A comparative analysis of historical housing trend data from 1929 to 2012 will reveal how housing designs indicate shifts in societal expectations for standards of living across generations.
Contextual Background
Almost a century ago, people sought interaction with others outside of the home. Children played outside. Adults interacted in the town square. This allowed for house size to be kept minimal (ASHSB, 1929). Over the 20th century, house size has increased substantially (U.S. Census Bureau, n.d., b.). Although the average square footage of houses in the U.S. is well below 3,000 square feet, there are many cases in which houses are built 10 times that size (Chung, 2012). A house measuring at 31,500 square feet in Greenwich, Connecticut features "a 2,500 square foot master suite and a basement with a theater, wine cellar, juice bar, dance studio, and sauna" (Chung, 2012). The master suite alone has more square feet of area than the average house in the U.S. (Chung, 2012).
An article by Elizabeth S. Padjen (2004) published in Architecture Boston, titled "The Incredible Expanding House," focuses on custom homes built by Acorn Structures and Deck House, Inc. and Acorn Structures' demand for larger homes. Their most popular floor plans in 1980 were comprised of three to four bedrooms and were around 2,130 square feet. What was most instructive in the subsequent decades was that the number of bedrooms stayed consistent while the square footage increased to 3,684 square feet in 2000 (Padjen, 2004). This means that while the number of bedrooms are not increasing, home size is expanding.
Not only are houses becoming larger in size, many use much more of the space within their building lot for home construction. Yards are giving way to more square footage inside the house. The lawn, which used to be the pride and joy of most households, is now mostly an afterthought (Knack, 1999). Because of these issues, some cities are now regulating how many square feet can be built per lot size in many different ways. Although real estate agents don't enforce city ordinances, in some cities a document is attached to sale contracts saying that the city discourages teardowns. According to Merriam-Webster (2012), to tear down is to take apart. In this case, a teardown is taking apart an existing house to build a new house in its place. Although officially discouraging teardowns may not stop teardowns from happening, it at least makes people consider other methods. The second way they control square feet and spatial volume of house per lot size is through a building scale ordinance. This type of ordinance is explained as a floor-area ratio that counts vaulted spaces to control the mass of a house. This ratio calculates not only square footage of a house, but the volume (Knack, 1999).
Methods
The U.S. Census Bureau started tracking housing data in 1973 by number of bedrooms, bathrooms, and square feet of floor area. With no source of data on house sizes in the early 20th century to use in comparison with recent decades and to set a baseline for this study, the author sought data from Small Homes of Architecural Distinction by the Architects' Small House Service Bureau (ASHSB). This source provided multiple house plans of what was viewed as the ideal small house in the early 20th century. The ASHSB is an agency that was founded in 1919 by a small group of architects from Minnesota in part because of the low standard of housing after World War I (Reiff, 2001). They "sought to provide solutions to the shortage of affordable middle-class housing in the United States" (Tucker, 2008). The requirements of the "small house" are that it "consists of no more than six principal rooms and has an area of no more than 30,000 cubic feet" (Tucker, 2008). The ASHSB was endorsed by the American Institute of Architects (AIA) and gained approval by the U.S. Department of Commerce within the same year. It was then formed into a national bureau with regional offices around the country (Reiff, 2001).
The 1929 publication Small Homes of Architectural Distinction, –comprised of hundreds of pages of floor plans – depicted the ASHSB's proposal for what the average middle-class home could be. Due to the lack of U.S. Census housing data from before 1973, number of bedrooms, number of bathrooms, and square footage was recorded from the floor plans provided in Small Homes of Architectural Distinction. To reduce the number of house plans analyzed, the data set was reduced by documenting the floor plans on every third page within the publication. The number of bedrooms, bathrooms, and square feet of area were recorded. The data used for 1980, 1990, 2000, and 2010 were taken from the U.S. Census Bureau historic housing data provided in their online database. The data include number of bedrooms, bathrooms, square feet of area, average household size, and adjusted household income. Average household size for 1929 was found on the U.S. Census Bureau online database as well. It was provided in categories ranging from one person households to eight or more persons per household. The average household size was then calculated by this author based on the data provided. Data were collected by analyzing the previous factors to find trends or correlations between factors. These analyses were then used to form the platform for this paper.
Findings
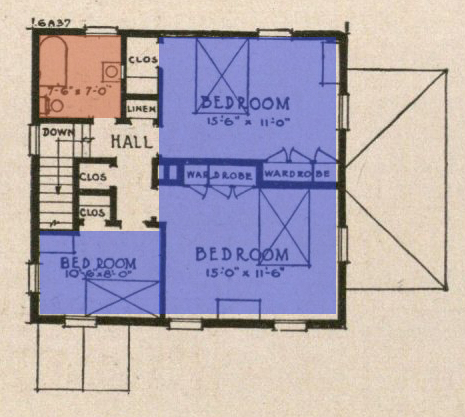
The data collected in Small Homes of Architectural Distinction found that the architects providing floor plans to consumers in 1929 recommended the average square feet per household be 1,366 while its median was measured at 1,334 (ASHSB, 1929). The most popular floor plan from Small Homes of Architecural Distinction was 6-A-37, a colonial house (Tucker, 2008).
Image 1.1 Plan 6-A-37 in Small Homes of Architectural Distinction.
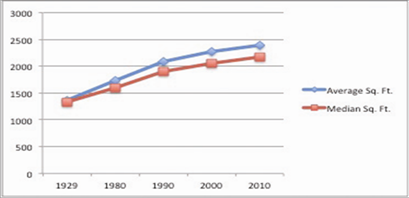
Through the following decades, not only did both average square feet and median square feet increase, the gap between the two also increased. This author created Figure 1.1 in order to demonstrate this gap. In 1980, the gap between average square feet and median square feet was 145 square feet. In subsequent decades, this number increased to 175 square feet in 1990, 209 square feet in 2000, and finally 223 square feet in 2010 (U.S. Census Bureau, n.d., b). These data indicate that not only are households becoming larger in size, there is a growing divide between smaller homes and larger homes. "Large" homes are now becoming exponentially more spacious, creating a higher average square footage over median square footage.
Figure 1.1 Average vs. Median Square Feet. Demonstrates Average Square Feet vs. Median Square Feet per American Household.
In addition to finding average square footage, number of bedrooms and number of bathrooms, the data were then compared to changes in the number of occupants and household income. As shown previously, house size grew steadily over the past century. Although house size grew at a steady pace, the number of occupants in the household was almost cut in half. In 1929, the average number of occupants was 4.32 (U.S. Census Bureau, 1940). By 2010, the number of occupants per household was 2.58 (U.S. Census Bureau, n.d., a.). One of the limitations of this study was U.S. Census Bureau data from 1930 from which the number of occupants was derived. At that time, the U.S. Census Bureau combined all households over eight people into one category of eight or more. In calculating the number of household occupants for this study the number eight was used for this category. Thus the average number of household members may have been higher than the data represented herein.
Figure 1.2 was created by this author to show the correlation between the number of household occupants, household income, number of bedrooms, number of bathrooms, and average square footage. The growth in average number of bedrooms from two in 1929 to three in succeeding decades is shown in Figure 1.2. This further demonstrates how Americans are requiring more space per person. The number of occupants per household was 4.32 people in 1929 while there was an average of two bedrooms—the average recommended by the ASHSB. This means there were over two people per bedroom. In 2010 there was an average of three bedrooms per household and only 2.58 people, meaning there are more bedrooms than people, as well as significantly more space per person. The ASHSB recommended the average square feet per person in 1929 to be 316 square feet (ASHSB, 1929). In a study by Wilson and Boehland (2005), which also compared home size with family size, the square footage per person in 1950 was about 290 while by 2003 it had tripled to 893 (Wilson & Boehland, 2005). As of 2010 the U.S. Census Bureau reported this number had reached 927 square feet.
Income per household was the most unstable piece of data through the century. This was to be expected as the U.S. economy fluctuates. For the purposes of this study, average income has been converted to 2010 dollars. This resulted in the 1929 average household income being estimated at around $76,000. By 1980, the average household income had dropped considerably to $53,000, a 30 percent drop (U.S. Census Bureau, n.d., b.). The economies of the late 1980s resulted in only a small growth in income between 1980 and 1990 of a little over $7000, or 13 percent. From 1990 to 2000 there was another increase, this time by 20 percent or $12,000. There was another economic downturn between 2000 and 2010, when a slight decline of almost 7 percent, from $72,339 to $67,530 was recorded (U.S. Census Bureau, n.d., a).
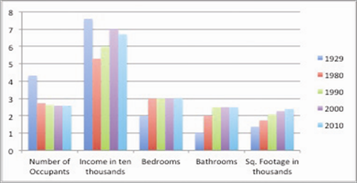
Figure 1.2 Number of Occupants, Income, Bedrooms, Bathrooms, and Square Footage per Household. Demonstrates the Average Number of Occupants, Adjusted Income, Bedrooms, Bathrooms, and Square Footage of Households. Income amounts were provided by the U.S. Census Bureau, adjusted to 2010 dollars.
Another finding of the analysis was the difference in the number of bathrooms compared to the number of bedrooms in new single-family houses in metropolitan areas compared to non-metropolitan areas. This author created Figures 1.3 and 1.4 from U.S. Census data to show the relationship between the number of bathrooms in households with two or fewer bedrooms inside metropolitan areas versus outside metropolitan areas (U.S. Census Bureau, n.d., a.). Figure 1.3 demonstrates the most fluctuation in the number of bathrooms by percent distribution. The percent distribution of one-and-a-half bathrooms and two bathrooms trend away from each other until 2004 when they gradually start to trend back together. Between 2009 and 2010 they trend opposite directions and one-and-a-half bathrooms become the most common. Another curious relationship in Figure 1.3 is between one-and-a-half and two-and-a-half bathrooms. The percentages differ significantly until the period between 2004 and 2007, when the percentages vacillate until they trend in opposite directions again.
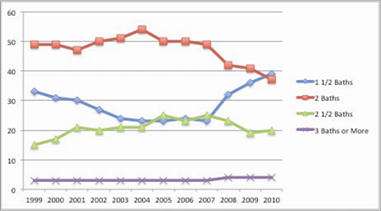
Figure 1.3 Number of Bathrooms Inside Metropolitan Areas. Demonstrates the Number of Bathrooms in Households of Two Bedrooms or Less Inside Metropolitan Areas by Percent Distribution.
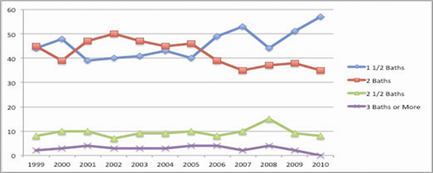
Figure 1.4 Number of Bathrooms Outside Metropolitan Areas. Demonstrates the Number of Bathrooms in Households of Two Bedrooms or Less Outside Metropolitan Areas by Percent Distribution.
For areas outside of metropolitan cities, Figure 1.4 shows a consistent trend in a smaller number of bathrooms. Although Figure 1.3 shows an intermingling of multiple numbers of bathrooms, non-metropolitan areas clearly demonstrate a large percentage of households with one-and-a-half or two bathrooms. In the earlier part of the decade, the percentage of households wavers between one-and-a-half bathrooms and two bathrooms until 2006, when they shift for the last time and trend in opposite directions. By the end of the decade, households with one-and-a-half bathrooms made up almost 60 percent of households outside of metropolitan areas. Households with two-and-a-half bathrooms or more never assumed a significant percentage of the data.
Economic Implications
The American economy has seen much fluctuation throughout the 20th and into the 21st century with a series of market expansions and recessions. Americans have spent over a quarter of the past 40 years in major economic recessions that started in the early 1980s and late 2000s (Leonhardt, 2009). The recession in the 1980s was brought on by the steep increase in interest rates used to try to break the rise in inflation, which caused home prices to drop (Leonhardt, 2009).
Figure 1.5 was created by this author to show the fluctuation in the square footage of houses built in the 1980s. Houses built with 1,200 to 1,599 square feet were the highest percentage category. At the beginning of the decade, the percentage was fairly steady between 29 and 31 percent. Then starting in 1987, there was a sharp decline of 3 percent, from 30 percent in 1986 to 27 percent. For the rest of the decade, the percentage steadily declined until it reached 22 percent in 1990. This decline in percentage is most likely because of the Tax Reform Act of 1986 (TRA 86). TRA 86 was passed to encourage home ownership and mortgage debt in place of consumer debt. There were many incentives created within TRA 86, such as a tax deduction for mortgage interest and the ability to borrow against home equity for consumer goods (Maki, 2001). This author asserts that these incentives changed the course of the purchasing of homes. With these incentives to assume mortgage debt in place, Americans started building larger houses than before, creating a decline in the percentage of those under 1,600 square feet.
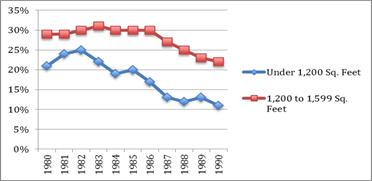
Figure 1.5 U.S. Home Square Footage. Demonstrates the Percentage Categories of Home Square Footage of New Construction from 1980 to 1990.
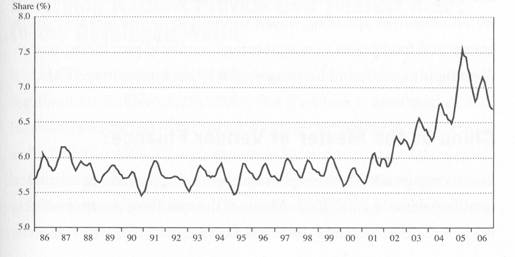
Figure 1.6 Median Home Prices vs. Household Income. Demonstrates median sales prices of homes sold vs. American household income from 1986 to 2006. Found in The Cost of Capitalism (p. 133), by Robert J. Barbera, 2009, New York: McGraw-Hill. Copyright 2009 by The McGraw-Hill Companies.
It has been argued that the recession that began in 2008 was created because of the housing market (Barbera, 2009). The immediate causes of the recession were the major flaws in the new mortgage loans available to homebuyers starting in 2001 (Barbera, 2009). It was believed that because home prices were still on the rise, the loans were safe. Homebuyers took on loans that carried a much higher risk in order to buy larger homes than they were able to previously (Barbera, 2009; Jackson, 2006). These loans made home prices rise by 10 percent per year from 2001-2005, while household income only rose at a rate of 4 percent per year (Barbera, 2009). As shown in Figure 1.6, during this time the national median home price went from six times the national average household income to over eight times the average (Barbera, 2009). Although the average income was increasing, the prices of the homes Americans were purchasing continued to outgain household income.
Cultural Implications
Now, houses are expected to fulfill every need or want of the family (Jackson, 2006). They come equipped with theaters, gyms, bowling alleys, indoor swimming pools, and basketball courts – activities that Americans used to participate in outside of the home. Americans require instant gratification, which leads to the need for everything to be within reach. This requirement leads to the increased size of the American home.
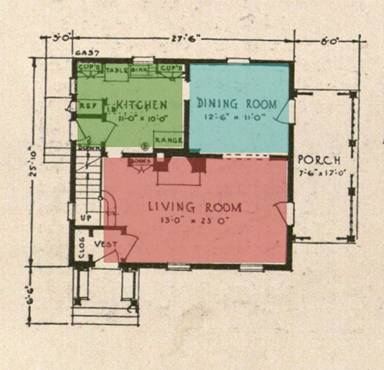
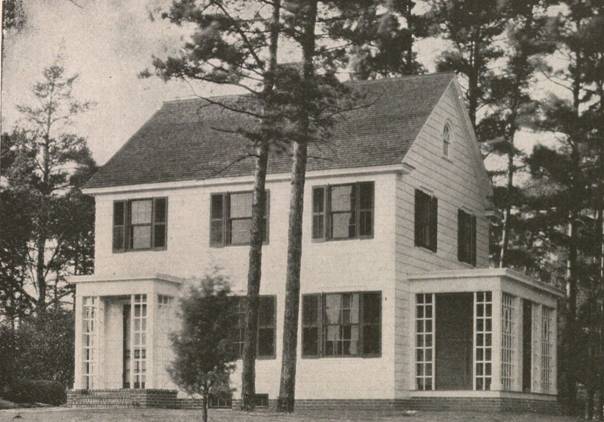
Image 1.2 & 1.3 Floor Plan 6-A-37 in Small Homes of Architectural Distinction. This plan was chosen to represent 1929 because it was the most built plan from Small Homes of Architectural Distinction. (ASHSB, 1929).
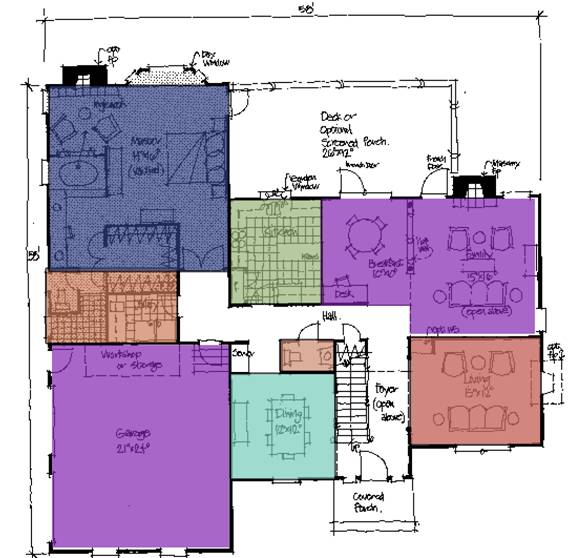
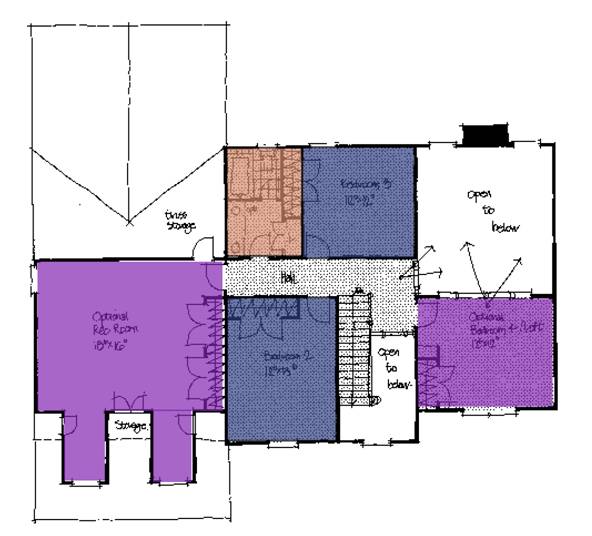
Image 1.4 & 1.5 Floor Plan of house built in 1990 (Wentling, 1990). This plan was chosen because its square footage is close to the national average square footage in 1990.
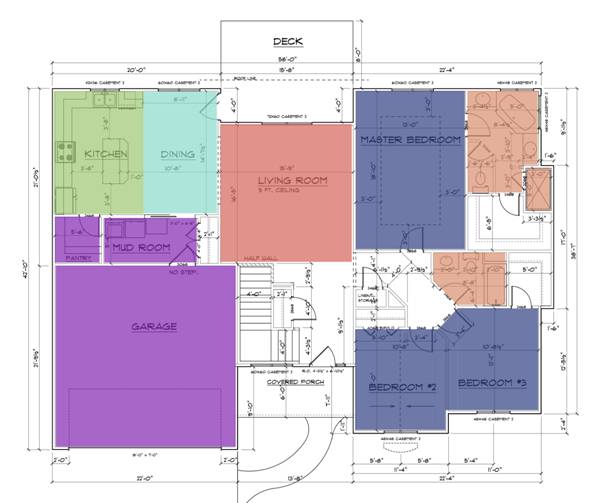
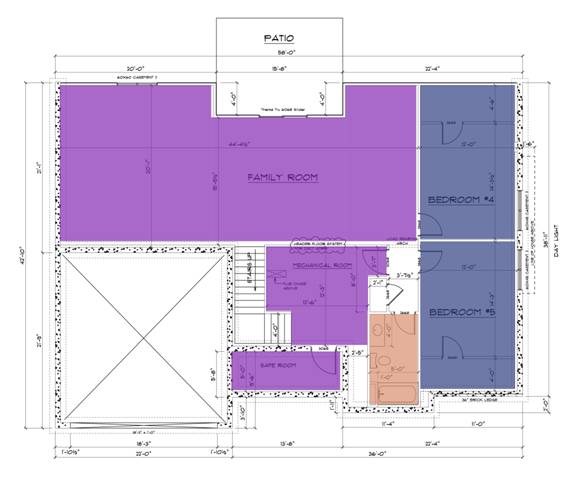
Image 1.6 & 1.7 Floor plan of house built in 2010 (Braley, 2010). This plan was chosen because its square footage is close to the national average square footage in 2010.
In 1929, the home layout was simple (ASHSB, 1929). Images 1.2 and 1.3 show there was a living room, kitchen, dining room, and multiple bedrooms with a bathroom. By 1990, the home layout had evolved. The same rooms from the previous decades were still present, but new rooms appeared. There was no longer just a living room but a formal living room and a more casual family room. There was no longer just a dining room but a formal dining room and a more casual breakfast nook. An attached garage was also present. By 1990, the "master suite" had appeared. The master suite consists of a bedroom, usually the largest of the house, and an attached bathroom. In addition to bedrooms and a bathroom on the second floor, an optional recreational room and loft were present (Wentling, 1990).
Images 1.6 and 1.7 show additional changes in 2010. In 1990, the American house was starting to be built with an open concept but by 2010 the idea of an open concept was fully embraced. An open concept refers to having few or no internal walls or partitions (Collins English Dictionary, 2009). Houses built in 2010 contain rooms that flow into each other and are larger in size (Braley, 2010). Another thing that grew in size and quantity throughout the century was closets. In 1929, there were few closets in the house and ones present were small (ASHSB, 1929). By 1990 and 2010, there were additional closets added and they became much larger in size (Wentling, 1990; Braley, 2010).
There have been three factors identified as contributing to the rise in house size: sense of community, bigger is better, and diminished craft (Wilson & Boehland, 2005). The first, a sense of community, refers to the loss in a sense of community within our culture. The home has become a fortress that has to contain everything the users need and want, including multiple forms of entertainment (Wilson & Boehland, 2005; Bowen, 2007). The second, bigger is better, is what the construction industry was selling to Americans. This idea has been heard, loud and clear, as home size is continuing to increase. The last, diminished craft, refers to Americans mistaking more space for "grandeur" when in fact, overlarge spaces are creating sterile homes (Wilson & Boehland, 2005).
"In many cases, people who live in very large homes tend to gravitate toward key areas of the house, leaving the other rooms to sit vacant" (Kodis, 2003). Americans feel like they need these large homes to use as a status symbol, to show that they are better off than their neighbors. It is "keeping up with the Joneses" in its most true form. They build large homes with formal living rooms and dining rooms that only get used once or twice a year, usually during holidays. Instead they gravitate toward rooms that feel cozy and provide the most comfort. It is human nature to seek refuge, to feel safe (Kodis, 2003).
Summary and Further Research
A comparative analysis of historical housing trend data from 1929 to 2012 revealed how housing designs indicate shifts in societal expectations for standards of living across generations. Through the decades, there has been a definite increase in the number of bedrooms, bathrooms, and square feet of area per American household. Although these statistics have increased, the number of occupants per household has decreased by half and household income has showed fluctuation and has recently been on the decline (U.S. Census Bureau, n.d., a.). The American economy and social culture have impacted how Americans build their homes—mostly through square footage (U.S. Census Bureau, n.d., b.).
During the data-collection process, there were many curiosities found that had no bearing on the main argument of this paper. One of these curiosities, the number of bathrooms compared to the number of bedrooms in new single-family houses in metropolitan areas compared to non-metropolitan areas should be researched further. Another question that arose was how society's views can and did influence our view of the American household. By looking at the statistics provided by the U.S. Census Bureau, it was found that every category showed an increase. The relationship between these increases and society's view of the household should be explored further.
References
Architects' Small House Service Bureau of the United States. (1929). Small homes of architectural distinction; A book of suggested plans designed by the Architects' Small House Service Bureau, Inc. New York: Harper & Brothers.
Barbera, R. J. (2009). The cost of capitalism. New York: McGraw-Hill.
Bowen, T. S. (2007). Downsize me! Shrinking the McMansion diet. Architectural Record , 195(11), 40.
Chung, J. (2012, February 10). Living very large; shooting ranges, an indoor tennis court, a bedroom bigger than many houses: For a small cadre of very wealthy owners, building big is back. A bird's-eye view of some of the mega mansions going up across the country. Wall Street Journal (Online). Retrieved from http://search.proquest.com.er.lib.k-state.edu/docview/920666496?accountid=11789
Jackson, J. W. (2006, Jul 09). Living large: Buyers' demand for bigger, better houses shapes new generation's 'dream home. McClatchy - Tribune Business News, pp. 1-1. Retrieved from http://search.proquest.com.er.lib.k-state.edu/docview/463509890?accountid=11789
Knack, R. (1999). Cutting monster houses down to size. Planning , 65(10), 4-8.
Kodis, M. (2003). Blueprint small. Layton, UT: Gibbs Smith.
Leonhardt, D. (2009, January 20). The economy is bad, but 1982 was worse. The New York Times.
Maki, D. M. (2001). Household debt and the tax reform act of 1986. The American Economic Review, 91(1), 305-319.
Padjen, E. S. (2004). The incredible expanding house. Architecture Boston, 7(2), 26-29.
Reiff, D. D. (2001). Houses from books: Treatises, pattern books, and catalogs in American architecture, 1738-1950. University Park, Pa.: Pennsylvania State University Press.
Tear down (n.d.). In Merriam-Webster online. Retrieved from http://www.merriam-webster.com/dictionary/tear%20down
Tucker, L. M. (2008). The Architects' Small House Service Bureau and interior design in the 1920s and 1930s. Journal of Interior Design , 34 (1), 57-69.
U.S. Census Bureau. (1940, May 17). Families in the United States by type and size: 1930. Retrieved May 14, 2012 from http://www2.census.gov/prod2/decennial/documents/Dub789.pdf
U.S. Census Bureau (n.d., a). Historical income tables: Households. Retrieved May 11, 2012 from http://www.census.gov/hhes/www/income/data/historical/household/index.html
U.S. Census Bureau (n.d., b). Characteristics of new single-family houses completed. Retrieved May 18, 2012 from http://www.census.gov/construction/chars/completed.html
Wentling, J.W. (1990). Housing by lifestyle. New York: McGraw-Hill.
Wilson, A., and Boehland, J. (2005) Small is beautiful: U.S. house size, resource use, and the environment. Journal of Industrial Ecology 9(1-2), 277-287.
Image References
Architects' Small House Service Bureau of the United States. (1929). Small homes of architectural distinction; A book of suggested plans designed by the Architects' Small House Service Bureau, Inc. New York: Harper & Brothers.
Barbera, R. J. (2009). The cost of capitalism. New York: McGraw-Hill.
Braley Construction, Inc. [General Contractor]. (2010). Retrieved November 20, 2012.
Wentling, J.W. (1990). Housing by lifestyle. New York: McGraw-Hill.
|