Exploration of Beverage Selection of Students Attending a Historically Black College or University (HBCU)
Laurel Huffman
Malinda D. Cecil*
University of Maryland Eastern Shore (UMES)
Keywords: nutrition, beverage selection, healthy lifestyles, college students
Abstract
Previous research indicated that college students attending predominantly white institutions (PWI) tend to select more unhealthy beverages than healthy beverages when choosing a drink (Mead, 2009). The purpose of this study was to investigate the types of beverages consumed by students attending the University of Maryland Eastern Shore (UMES), a Historically Black College or University (HBCU). A validated beverage questionnaire was distributed over an 8-week period to students studying in a computer lab. Out of a total of 35 surveys collected only 27 surveys were valid for analysis. Survey results for the top 5 beverages consumed by students at an HBCU were consistent with other beverage intake studies. Unlike the results from pervious beverage studies, students at UMES reported water as their top choice, which is inconsistent with results from PWI. Although students at UMES reported drinking more water, the average caloric intake from beverages at UMES was 755 calories per day, over one-fourth of a typical college student's daily caloric needs. Additionally, 25.9 percent of the students consumed more than 1,000 calories from beverages. These finding suggest that while water is the beverage of choice for the majority of students surveyed, they are still consuming many high calorie beverages of various nutritional content. Further research is planned to explore factors that influence college student's beverage selection.
Introduction
Many chronic diseases have been contributed to the lack of physical activity and the high caloric beverages that are heavily consumed within the United States of America (Mead, 2009). Previous research indicated that college students tend to select more unhealthy beverages than healthy beverages when choosing drinks, which can affect their short and long-term health (Kicklighter, Koonce, Rosenbloom, & Commander, 2010). The purpose of this study was to investigate the types of beverages consumed by students attending the University of Maryland Eastern Shore (UMES), a Historically Black College or University (HBCU). To explore this research topic the researcher attempted to uncover the types of beverages students consumed at UMES to determine the quantity which students consume beverages as well as students' caloric intake from the beverages.
Methods
The research was conducted using a quantitative data collection technique, upon approval from the Institutional Review Board (IRB) at UMES. This study's procedures involved distributing a validated beverage questionnaire attained, with permission, from Virginia Polytechnic Institute and State Universities. Using a random method of convenience sample, data were collected over an 8-week period to students enrolled at University of Maryland Eastern Shore who utilized the Math 101 – Intermediate Algebra and Math 109 – College Algebra Computer Labs in Kiah Hall.
An informed consent form was provided for all students to read and agree upon the conditions before completing the questionnaire. Students were asked to complete questions related to the types of beverages they consume, how often they consume them, and at what quantity they consume each time. Out of a total of 35 surveys collected, 27 surveys were valid for analysis. There were no incentives given to participants for their participation in the study.
Results
The sample consisted of 27 students, 18 females and 9 males. The majority of the participants were African American (89%) with the remaining participant ethnicity consisting of Caucasian and Hispanic students (11%).The overall classification of the students varied across all classifications with lowerclassmen (e.g., freshmen and sophomores) representing 52 percent of the sample, upperclassmen (e.g. juniors and seniors) representing 41 percent of the sample, and graduate students accounted for 7 percent of the sample. Additionally, the range in the student's age also varied, there were 6 under the age of eighteen, 9 who were nineteen, 20 who were twenty, 4 who were twenty-one, and 22 who were over twenty-two years of age.
Survey results for the top 5 beverages consumed by students at an HBCU were consistent with other beverage intake studies (Hendrick, Comber, Estabrooks, Savla, & Davy, 2010). The top 5 beverages consumed by the students were water, sweetened juice beverage/drink, 100% fruit juice, sweetened tea, soft drinks (regular) (Table 1). Unlike the results from pervious beverage studies, students at UMES reported water as their top choice, which is inconsistent with results from Predominantly White Institutions (PWI) (Hendrick, Comber, Estabrooks, Saval, & Davy, 2010).
Table 1 – Top 5 Beverages Consumed
Beverage
Rank
Water
1
Sweetened Juice Beverage/Drink
2
100% Fruit Juice
3
Sweetened Tea
4
Soft Drinks, Regular
5
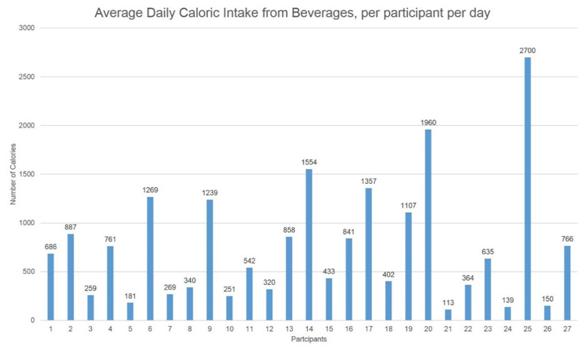
Survey results indicated that the average caloric intake from beverages consumed by UMES students was 755 calories per day, over one-fourth of a typical college student's daily caloric needs ("How Many Can I Have?," n.d.). (Figure 1.1) There were a significant number of students who consumed over 500 or/and 1,000 calories from beverages per day. A total of 15 (55.5 %) of the student consumed on average more than 500 calories per day from beverages. Additionally, a total of 7 (25.9 %) of student consumer on average more than 1,000 calories per day from beverages. Consuming more than 500 calories from beverages per day means that over 1/4th (25 %) of your recommended daily intake is contributed beverages calories alone. Even more so, consuming more than 1,000 calories from beverages per day means that over half (50 %) of your recommended daily intake is contributed to beverages calories alone.
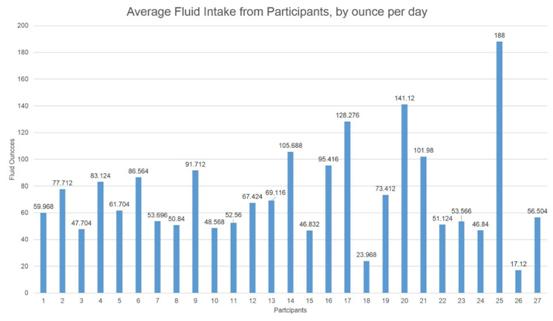
The survey results indicated that the average fluid intake at UMES was 73 ounces per day; otherwise known as 9 cups per day. (Figure 1.2) The fluid intake ranged from 17 – 188 ounces per day, which can be translated to 2 – 24 cups per day.
Figure 1.1 Average Caloric Intake from Beverages
Figure 1.2 Average Daily Fluid Intake from Beverages
Limitations
Although, the sample population was easy to attain, it allowed for some limitations in the range and number of student's participating in the study. Due to the lack of an incentive to complete the survey the number of completed surveys was affected. As usual, time is always a factor during the data collection process; impacting the overall quantity of surveys collected.
Discussion
The top beverages consumed in the study were consistent with other extensive beverage surveys and studies conducted at a PWI. However, the overall ranking of the beverages was different. Thus, the data are not necessarily consistent with beverage surveys previously conducted. Students at UMES indicated water as their first beverage of choice, while studies conducted at a PWI did not indicate water as their first beverage of choice (Hendrick, Comber ,Estabrooks, Saval, & Davy, 2010). This probes the question, why is there such a significant difference in the overall ranking of beverages selected between students at a HBCU and a PWI? This is a possible area for further research.
The studies concluded that the average caloric intake from beverages was 755 calories per day from beverages. When taking the recommended 2,000 daily caloric intake limit into consideration for both food and beverage consumption, a total of 755 calories from beverages per day is rather high. At roughly 38 percent of calories attained from beverages on average in a student's diet at UMES, it raises concern for potential excessive caloric intake overall, from both food and beverages.
Although, the range of the 27 participants' caloric intake was from 113 calories to 2700 calories for beverages per day, the high caloric intake of 55.5 percent of students consuming more than 500 calories from beverages and 25.9 percent consuming more than 1,000 calories from beverages per day on average is very alarming for the overall health of the students at UMES. With increasingly more evidence linking high caloric and sugary beverages to chronic diseases, it raises a major public health concern for the students enrolled at UMES and other college students around the world.
It is recommend that further studies explore factors that influence college student's beverage selection. It is important to understand why students consume such a high caloric intake from beverages on average per day. Additionally, it is important to discover other issues and problems that facilitate students' beverage choice behaviors before establishing educational and/or medical intervention. Any educational or intervention efforts should seek to increase the longevity and overall health of individuals while equipping them with the tools they need to make healthier choices.
Participants
Top 3 Beverages
6
Energy/Sports Drinks
Hard Liquor
Beer, Ales, Wine Coolers, Light Beer9
Hard Liquor
Sweetened Juice Beverage/Drink
Soft Drinks, Regular14
100% Fruit Juice
Sweetened Juice Beverage/Drink
Soft Drinks17
Sweetened Juice Beverage/Drink
Sweetened Tea
Hard Liquor19
Hard Liquor
Tea or Coffee w/cream and/or sugar
Sweetened Juice Beverage/Drink20
100% Fruit Juice
Hard Liquor
Beer, Ales, Wine Coolers, Light Beer25
100% Fruit Juice
Sweetened Juice Beverage/Drink
Sweetened TeaTable 1.2 – Example of Students Top 3 Beverages Choices
Reference:
Hedrick, V. E., Comber, D. L., Estabrooks, P. A., Savla, J., & Davy, B. M. (2010). The Beverage Intake Questionnaire: Determining Initial Validity and Reliability. Journal of The American Dietetic Association, 110(8), 1227-1232. doi:10.1016/j.jada.2010.05.005
How Many Can I Have? (n.d.). Retrieved March 25, 2014, from http://www.choosemyplate.gov/weight-management-calories/calories/empty-calories-amount.html
Kicklighter, J. R., Koonce, V. J., Rosenbloom, C. A., & Commander, N. E. (2010). College Freshmen Perceptions of Effective and Ineffective Aspects of Nutrition Education. Journal of American College Health, 59(2), 98-104. doi:10.1080/07448481.2010.483709
Mead, A. S. (2009). Gender Difference in Food Selection of Students at a Historically Black College and University (HBCU). College Student Journal, 43(3).
|

