Assessing the Nutritional Knowledge and Exercise Habits
of Community College Students
Heather Orza
Herkimer County Community College, NY
Abstract
With today’s hectic lifestyle, eating well-balanced meals and exercising regularly are not always a top priority. College students may have to juggle school, work, and other obligations, which can leave limited time to exercise or plan and prepare meals. In this study a nutritional survey was created to examine the nutritional knowledge and exercise habits of Herkimer County Community College students. Of the 3,130 students enrolled at the college (full-time, part-time, Internet Academy), 453 students completed the Nutrition Survey, which accounts for about 14% of all students. The age group of the students that took the survey ranged from seventeen years of age to fifty-two years of age. The most common age group surveyed was 19 years old, accounting for nearly 34% of all students in the study. Approximately 58% of the surveys were completed by women and 42% by men. The surveys were divided into weight categories (underweight, normal weight, overweight, or obese) according to the students’ BMI (body mass index) before the responses were analyzed. The results of this study indicated that while many exercised regularly, a majority of the students lacked even basic knowledge of the USDA’s current recommendations on daily nutrition. Only 49% of all students surveyed were able to correctly identify the current Food Guide Pyramid. Just 2% of all students surveyed could identify all of the correct food group servings and also said they get enough of the five groups everyday. Of the 453 students surveyed, 40% were either overweight or obese based on their BMI. More importantly, 46% of these students did not correctly match their perceived body type with their actual body type.
Introduction
With obesity and chronic diseases, such as heart disease, stroke, and certain cancers on the rise, the significance of healthy everyday eating habits and regular exercise needs to be stressed. On December 1, 1994, the USDA created the Center for Nutrition Policy and Promotion. “CNPP’s mission is to improve the health of Americans by developing and promoting dietary guidance that links scientific research to the nutrition needs of consumers” (1). This group’s job is to “improve the health of Americans by (a) advancing and promoting food and nutrition guidance for all Americans; (b) assessing diet quality; and (c) advancing consumer, nutrition, and food economic knowledge” (1). The main question is whether or not the USDA and the CNPP are doing enough to make sure that the public is adequately informed about proper diet and exercise.
The purpose of this study was to ascertain the level of knowledge possessed by college students in regard to eating a well-balanced diet and getting sufficient exercise. The Nutritional Survey was utilized to assess the BMI of students, their perceived body type, and their current exercise habits. It also allowed for observation of students’ daily eating habits: what they normally eat each day; how often they have snacks and fast food; and if they consume the recommended servings established by the USDA.
Background:
In 1862 President Abraham Lincoln created the United States Department of Agriculture (USDA). During this time period farmers accounted for about 58 percent of the total population in the United States. The USDA, or People's Department, was founded to help America’s farmers who needed quality seeds and information to grow better crops. Today the USDA has many responsibilities that range from being in control of the safety of meat, poultry, and egg products to educating the public about proper nutrition and diet and exercise (2).
In 1941, President Franklin Delano Roosevelt called to action a National Nutrition Conference, in which the USDA came up with Recommended Dietary Allowances (RDA’s). RDA’s identified values for daily caloric intake in addition to essential nutrients for Americans to follow (3). In 1956 the USDA introduced the Basic Four that included milk, meats, fruits and vegetables, and grain products. This nutritional guide was not intended to help Americans fulfill all of their daily caloric needs. It was assumed that individuals would eat more than the nutritional guide suggested in order to satisfy their hunger. The nutritional guide included insufficient information on sugar and fat intake as well as on appropriate daily caloric consumption (4).
In 1977 the U.S. Senate issued Dietary Goals for the United States, which was a focus of debate among nutrition and health professionals. One of the main discrepancies surrounding the new dietary goals was the fact that a recommendation for protein was not evident so the USDA chose not to adopt them. This attracted awareness for the need of the Federal government to take responsibility for supplying dietary guidance to the public. In 1979 the USDA replaced the Basic Four with the Hassle-Free Guide that added a fifth food group: fats, sweets, and alcohol. Because chronic diseases, such as heart disease and stroke, were increasing among Americans, the USDA needed to address the roles of unhealthy foods (3). The Hassle-Free guide stood apart from previous publications in that it paid particular attention to calories and dietary fiber and also pointed out the need to restrict sugar, fat, and alcohol intake (4). In the 1980’s the USDA teamed up with the U.S. Department of Health and Human Services to provide the public with reliable and consistent dietary recommendations. Together they created the first edition of the Dietary Guidelines for Americans. These guidelines were founded on the most current science available on diet and health and continue to be updated every five years (4).
To help the public become more aware of the USDA’s dietary guidelines, the USDA produced an image to represent the food groups. It needed to express three main ideas of a healthy diet, which include proportionality, moderation, and variety (3). In 1992 the first Food Guide Pyramid was finally released. It included graphics and text to express the importance of variety and proportionality when eating by showing pictures of foods from each food group and by altering the size of the food groups to express the amount that should be consumed daily (3). Today the Food Guide Pyramid is a common sight to most Americans since it can be found on the food labels of various commercially available products. In 2005 the USDA changed the design and appearance of the Food Guide Pyramid. The previous Pyramid featured a horizontal arrangement of the five food groups with the name of the category and the recommended servings within each group. The groups with the highest recommended servings were towards the bottom, or the base of the pyramid (grains, cereal, and bread group) and the groups with the most limited servings were placed at the top of the pyramid (5). The new Food Guide Pyramid features the food groups in colored vertical columns, and employs the image of a person running up stairs to stress the importance of both proper diet and exercise. The new dietary guidelines emphasize the actual amount of each food group that should be consumed daily based on age, sex, and level of physical activity, rather than daily servings (6).
For many years doctors have used various formulas to evaluate a person’s weight category (underweight, normal weight, overweight, or obese). Prior to the 1980s doctors commonly used the “weight-for-height” tables to determine a person’s weight category. There were two separate tables, one for men and one for women, and for each inch of height it included a range of body weights. Since these tables were based on weight alone and not body composition, they were limited in their accuracy (7). In the nineteenth century a Belgian statistician, named Adolphe Quetelet, studying social physics formulated the Quetelet Index of Obesity, which today is know as the Body Mass Index (BMI). This index calculated obesity by dividing the person’s weight (measured in kilograms) by the square of the individual’s height (measured in inches). It was not until the government started programs in the 1990s to promote healthy eating and regular exercise that the public became aware about BMI and how this information could pertain to the fight against weight loss (7).
Relevant Studies:
A study published in the Journal of American College Health in 1998 found that only 8% of the students consumed the minimum recommended number of servings for each one of the five food groups (8). A study assessing 387-college student’s understanding of serving sizes that was published in the Nutrition Research Newsletter noted that the most common mistake students were likely to make was underestimation of serving sizes (9).
The “Freshman 15” is a common term used to describe weight gain that is frequently seen among students during their first year of college. A study at Cornell University stated that important factors that contribute to college student’s increase in weight are the number of late evening meals and snacks, more meals eaten on weekends, and increased consumption of junk food (10).
Every five years the CNPP tries to assess the overall diet quality of Americans by using a Healthy Eating Index (HEI). According to the Healthy Eating Index of 1999-2000, only 10% of the population had a good diet, 16% had a poor diet, and the remainder had a diet that needed improvement. The results therefore indicated that only 10% of the population consumed adequate amounts of each of the five food groups. It also found that Americans particularly need to improve their intake of fruit and milk products. “Adults over age 50, females, and those with more education and income had a better diet, compared with their counterparts” (11). A study conducted at the Pew Research Center found that only 40% of Americans believed themselves to be overweight or obese, although official estimates found that about 60% of Americans were overweight or obese (12). A study conducted in April 2006 consisting of 104 adults whose ages ranged from 45 to 64, showed that just 15% of people who were classified as obese identified themselves as their correct body type. In contrast, 71% of people who were normal-weight and 73% of people classified as overweight were precise in their self-assessments (13). Another study performed by the American Journal of Medicine stated that 21% of Americans that were overweight believed themselves to be normal weight (14).
Hypothesis:
The hypothesis of this study is that the majority of college students will not be able to correctly identify the USDA recommended daily quantity of each of the food groups, and in addition will be lacking in their daily intake for each group. More importantly, previous studies lead us to suggest that many students in the overweight and obese weight categories of this study will not correctly identify their actual body type.
Methodology
In order to assess Herkimer County Community College student’s nutritional knowledge and exercise habits, a Nutritional Survey consisting of thirty-two questions was created (see Appendix A)
To make the survey as easy and effortless as possible for students to complete, many of the questions required “Yes” or “No” answers, or provided multiple-choice responses. The survey asked students four questions regarding how often they exercise, how long is each exercise session, and in what types of exercise they participate. Students were also asked what their perceived body type was and if they were currently on a diet. They were asked whether or not they normally eat breakfast, lunch, and dinner, as well as what they typically eat for each of the three meals. The survey asked how often throughout the day they eat snacks, what they typically eat for each meal, and how often each week they have fast food. The survey showed a graphic of the new Food Guide Pyramid that was introduced to the public in 2005, and then it asked students to tell what the picture represented. Finally the survey asked students if they knew how many cups or ounces of each of the five food groups is recommended by the USDA, and how many they typically consume each day.
The survey was handed out to the HCCC faculty to pass on to their students from February 15, 2006 to March 15, 2006. The survey was completely anonymous so that each student would feel comfortable answering all questions as honestly as possible. Since some people may feel uncomfortable with revealing their weight or other personal information, having the survey be anonymous makes people feel more relaxed and willing to be truthful when answering questions. Any student enrolled at Herkimer was permitted to complete a survey, which included full-time students, part-time students, and Internet Academy students.
Based on height and weight information provided by the students, the surveys were grouped according to their body mass index (BMI) and corresponding weight category. To calculate BMI, we divided the person’s weight (in pounds) by their height (in inches) squared and then multiplied that number by 705. The corresponding weight category and BMI have been established as follows: (a) <18.5- underweight,( b) 18.5 to 24.9- normal weight, (c) 25.0 to 29.9- overweight, and (d) >30.0- obese (7). Each weight category was further divided by sex, and subsequently the responses of each survey were recorded and analyzed.
Results
Of the 453 students that took the survey, 261 were completed by women (58%) and 192 surveys were completed by men (42%). There were no men categorized as underweight, and only 13 women (5%) were underweight. The normal weight category was comprised of 101 men (53%) and 158 women (61%). In the overweight category there were 59 men (31%) and 56 women (21%). Thirty-two men (17%) and 34 women (13%) were obese. Approximately 80% of all students surveyed were between 18 and 21 years of age.
Table 1: Demographic Information (453 Participants)
Underweight
Normal Weight
Overweight
Obese
Age
Men
Women
Men
Women
Men
Women
Men
Women
17-18
-
6
23
47
10
13
3
4
19-20
-
3
52
78
31
30
15
12
21-25
-
4
25
14
14
6
9
6
26-30
-
-
1
10
1
3
1
4
31-40
-
-
-
6
2
3
-
5
41-50
-
-
-
3
1
1
2
2
51-55
-
-
-
-
-
-
-
1
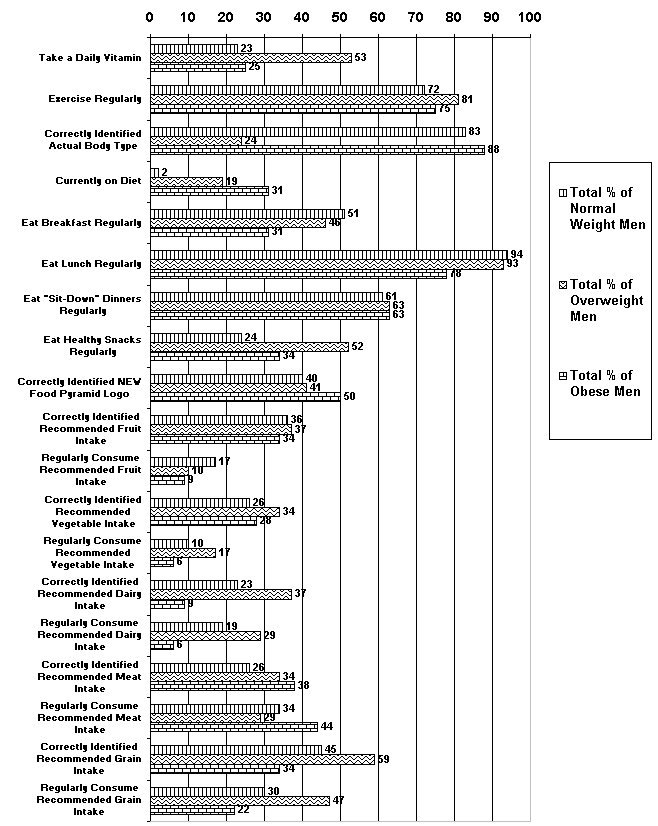
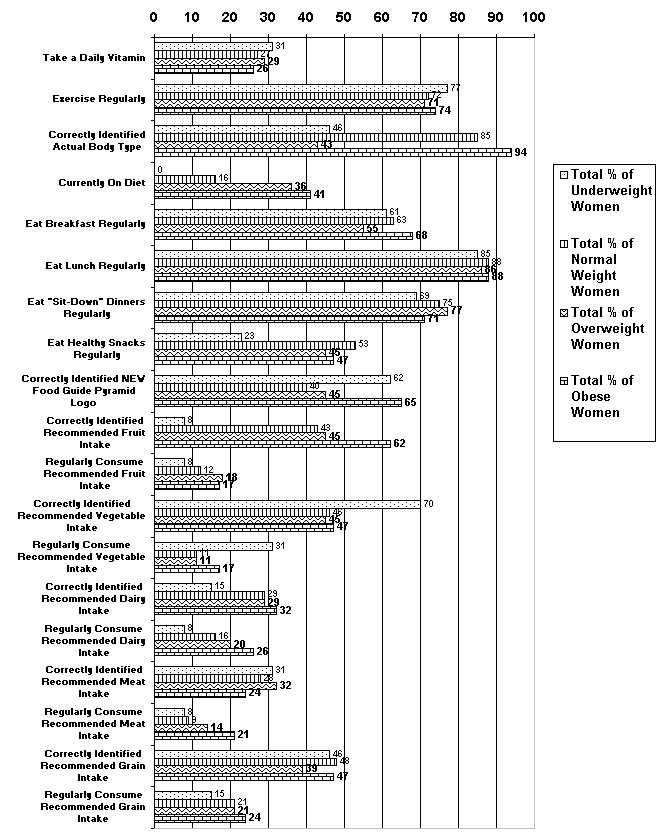
Figure 1 and Figure 2 are a summary of responses to all of the Nutritional Survey questions.
Figure 1: Analysis of Nutritional Survey Responses from Men
Figure 2: Analysis of Nutritional Survey Responses From Women
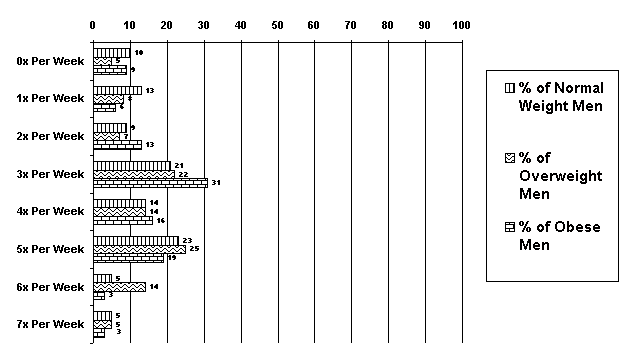
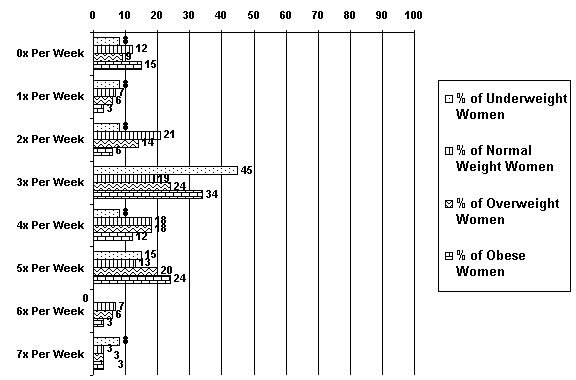
The first question of the survey asked HCCC students whether or not they take a daily vitamin. The group with the highest percentage of people that take a daily vitamin was the overweight men with 53%. Normal weight men were the least likely to take a daily vitamin (23%). Approximately 75% of all students surveyed said that they exercised regularly. The amount of time weekly that each group exercised was very diverse as seen in Figure 3a and 3b. Herkimer County Community College students typical exercised about three times each week. The amount of time that they spent exercising varied, but the most common time span was 30-60 minutes for men, and 20-30 minutes for women.
Figure 3a: Percentage of How Often Men at HCCC Exercise Per Week
Figure 3b: Percentage of How Often Women at HCCC Exercise Per Week
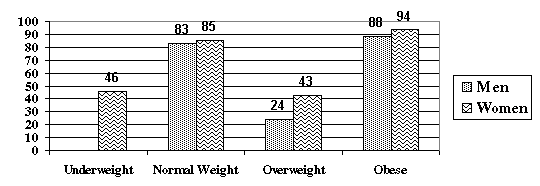
Students were then asked to identify their perceived body type: underweight, normal weight, or overweight (see Figure 4). Fifty-four percent of the women that were underweight believed that they were normal weight. The majority of normal weight men (83%) and normal weight women (85%) correctly matched their perceived body type with their actual body type. Only 43% of overweight women believed that they were overweight, while 57% believed that they were normal weight. Just 23% of the men in the overweight category believed that they were overweight. Roughly 88% of obese men and 94% of obese women matched their perceived body type with their actual body type.
Figure 4: Total % that Correctly Identified Actual Body Type
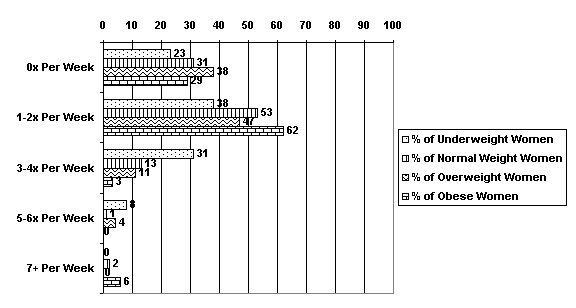
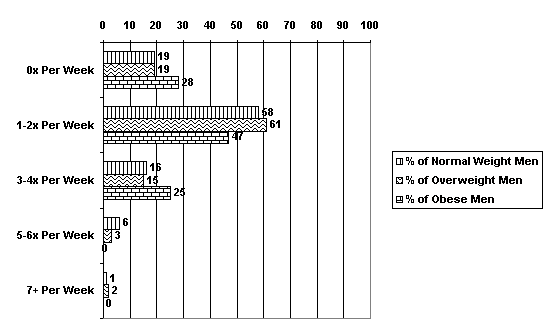
Of the 453 students that took the survey, 82 (18%) were on a diet. The most common diet was simply “eating healthy, well-balanced meals.” Other diet programs mentioned were: Weight Watchers, the Atkins diet, the South Beach diet, low-calorie, low-fat, and the Special K Two-Week diet. One person was a vegetarian and one person was on a diabetic diet. The group with the largest percentage of people on a diet (41%) was obese women. Breakfast was the least often eaten meal of the day, as 46% of the students responded that they do not normally eat breakfast. Overall, eighty-seven percent of students surveyed regularly eat lunch. The students were also asked whether they generally had a “sit-down” dinner, or a “dinner-on-the-go.” Overall, sixty-eight percent of students typically have a “sit-down” dinner, and about 32% usually have a “dinner-on-the-go.” The majority of students typically had snacks 2-3 times each day, and only about 40% of everyone surveyed said that they normally eat healthy snacks. Fast food is eaten most often by students 1-2 times each week while about 4% (19 of 453) eat fast food five or more times each week. See Figure 5a and 5b.
Figure 5a: Percentage of How Often Women Consume Fast Food Per Week
Figure 5b: Percentage of How Often Men Consume Fast Food Per Week
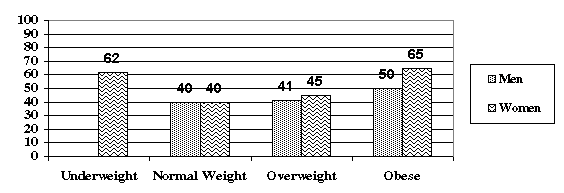
On the survey there was a picture of the new Food Pyramid created by the USDA. Of all students surveyed, only 49% were able to correctly identify the new Food Pyramid.
Figure 6: Percentage of Students Correctly Identifying the Symbol of the New Food Guide Pyramid
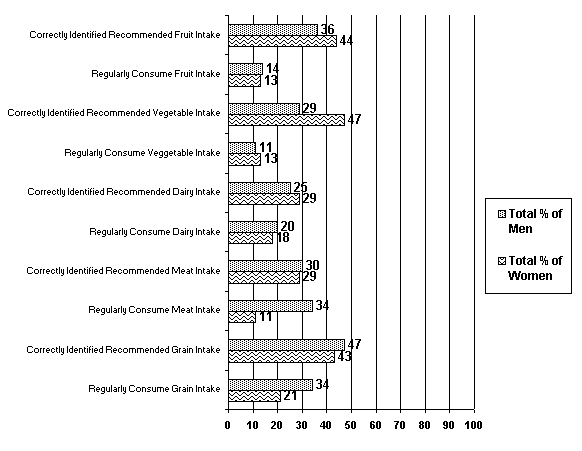
Students were then asked to circle the correct USDA recommended cups or ounces of each of the food groups and to estimate how many they typically consume each day. The USDA recommended servings for each of the food group are (s) fruits: 2- 2 ½ cups per day, (b) vegetables: 2 ½ -3 cups per day, (c) dairy: 3 cups, (d) meats: 5-7 ounces, and (e) grains: 6-8 ounces. Overall, only 38% of students knew the amount of fruit that should be eaten each day. Women in the obese category were the most likely to know the average of fruit needed per day (62%). A meager 13% of all students surveyed said that they eat the USDA recommended servings of fruit per day.
Only about 42% of HCCC students surveyed knew the recommended cups of vegetables recommended each day. Approximately 15% of all students estimated that they ate the recommended cups of vegetables per day, and less than a third of all students within each weight category met these values. Only 24% of all surveyed knew that three cups of dairy are recommended each day, while only 18% of all students estimated that they ate the recommended amount.
Thirty-four percent of students were able to correctly identify the average number of ounces of meat needed each day (5-7), while 77% of all students estimated that they did not eat the suggested amount. Forty-five percent of all students knew the average suggested number of ounces of grains per day (6-8), while 74% estimated that they did not eat this amount.
FIGURE 7: Five Food Group Responses
Discussion
After analyzing the survey data, it is evident that the diets of HCCC students do not adequately meet the criteria recommended by the USDA. On the survey, rather than ask students to identify the recommended number of “servings” for each of the five food groups, students were asked if they could accurately identify the correct “amounts” of each group that is suggested per day. Many people are more likely to be able to accurately identify how many servings are recommended, probably because this information has been accessibly located on the back of various different types of food packages sold at grocery stores for over a decade. The problem is that people may be unsure as to “what exactly is a serving.” For example, the old Food Guide Pyramid recommended that we eat 2-3 servings per day of foods in the Meat and Bean group. Today the new Food Guide suggests that the average American eat 5-7 ounces of this group each day. Few people are unaware of what constitutes an ounce or a cup of different types of food, or many do not regularly measure the amount of food that they eat. For this reason many people either are eating too much or not enough of the recommended servings of each food group. The USDA or the CNPP needs to do more to educate the public about these new recommendations. Recently the USDA launched a campaign called “5 A Day” to make people aware of the importance of eating a combination of five servings of fruits and vegetables each day. The entire budget for the "5 A Day" campaign is $3.5 million a year, compared to the $29 million spent in advertising for Pringles, $74 million spent advertising for M&Ms, $209 million for promoting Coke, and $665 million endorsing McDonald's (15). A Quarter Pounder sold at McDonalds contains approximately 4 oz. of meat, which unbeknownst to many may account for nearly all of the meat requirements for one day for some individuals.
This study found that overweight men were most likely to take a daily vitamin. Does this group take vitamins to substitute for good nutrition, or taking vitamins to try to be healthy and prevent disease? Underweight women were the next most likely to take a daily vitamin. Also more women (23%) than men (12%) were on a diet. An explanation for this could be that women are more self-conscious about their weight and appearance than are men. Thirty-two percent of all men surveyed take a daily vitamin, while only 23% of all women surveyed take daily vitamins. Maybe men are more likely to take vitamins because they think taking a pill can be a substitute for good nutrition and eating habits, while women are more likely to try various diets to lose weight.
The results of this study can be compared to a previous report assessing the understanding of serving sizes; that study noted that the most common mistake students were likely to make was underestimating serving sizes. The findings of this nutritional survey found that, of all five food groups, a mean of only 36% of all respondents were able to correctly identify the USDA recommendation for any single group, while approximately 80% of students do not typically eat the suggested amount of each food group. In this study about 60% of all respondents said that they do not typically eat healthy snacks. A study at Cornell University stated that important factors that contribute to college student’s increase in weight are the number of late evening meals and snacks, more meals eaten on weekends, and increased consumption of junk food. In this study numerous students said that they typically eat candy or other junk food, which would further support the conclusions of the Cornell study regarding the “Freshman 15.”
The Healthy Eating Index that is organized by the CNPP found that in 1999-2000 only 10% of the population consumed adequate amounts of each of the five food groups. It also found that Americans needed to improve their intake of fruit and milk products. It also observed that females have better diets than males. This study can be compared with the most recent results of the Healthy Eating Index in that only 9 students of the 453 surveyed could correctly identify the USDA recommended cups or ounces for each food group and said that they consumed this amount daily. The majority of the students’ answers were slightly below the correct USDA recommended values for each group, and the majority of students that do not get enough of each food group daily consume a lot less than the USDA recommendations. Further study is needed to determine if many students are consuming the USDA suggested amounts or more but do not know correct portion sizes or what a cup or ounce constitutes when if comes to various foods. This study also found that women were more likely than men to be able to recognize the correct amounts of the food groups, and women were also more likely to regularly eat the USDA recommended amounts. In this study the two food groups that students need to improve were their intake of fruit and vegetable groups, contrary to the finding that fruit and milk groups needed improvement by the Healthy Eating Index.
The studies conducted at the Pew Research Center and the study conducted by the American Journal of Medicine found that a large percentage of people in the overweight or obese categories classify themselves as normal weight. In this HCCC study, 40% of all students were classified, according to their BMI, as either overweight or obese, yet 46% of these students believed that they were normal weight. Some of the men and women that fell into the overweight category were likely not “overweight” in the sense that they have increased health risks. One of the problems of the Body Mass Index is that athletes that have more dense muscle than fat may fall into the overweight category. So although 25% of the 453 surveys were in the overweight category, some of them may have a healthy body weight. It is possible for a person to have a BMI greater than 30 and not be classified as obese. For instance, bodybuilders have a very high percentage of muscle mass, so their BMI could be over 30 (7).
Conclusion
According to the information given by Herkimer County Community College students, many are unaware of the current USDA dietary recommendations. The majority of students were not knowledgeable regarding the recommended amounts of each food group, and this may be a factor as to why they are not consuming the suggested amount of the five food groups each day. The large majority of students do adequately exercise each week, although the student’s knowledge of daily nutrition is insufficient. Only a scarce number of students were able to identify the correct amounts of each of the five food groups, while the majority was only able to correctly identify two or three of the accurate values, at most. To be in optimal health and help prevent diseases (such as heart disease, certain cancers, or stroke), a healthy, balanced diet in conjunction with moderate exercise is essential. Approximately 56% of all students surveyed were not able to correctly identify the new Food Guide Pyramid that was introduced to the public in 2005. More needs to be done by the USDA and the CNPP to make sure that the public is adequately educated on current USDA food recommendations. This study and others like it should be routinely shared with students in Nutrition, Health, or Wellness classes on all college campuses to spread awareness of inadequate dietary and exercise habits commonly seen among college students. People need to be aware of the importance of eating a variety of foods from each food group. The nutrients, vitamins, and minerals in each group have its own significance in helping our body to function properly. If we do not consume enough of certain food groups it can impair the body’s ability to adequately perform vital tasks to keep us feeling well and staying healthy. In addition, consuming too much of certain groups, such as foods high in fat or cholesterol, can also have damaging effects on the body.
In 2003 the leading causes of death among Americans were heart disease (685,089), cancer (556,902), and stroke (157,689) (16). With these chronic, diet-related diseases on the rise, adequately education for all Americans needs to become a priority. Those who are already educated on proper diet and exercise need to use this knowledge and make the time and effort to eat healthy, well-balanced meals and remain active throughout their life to help prevent these chronic and debilitating diseases.
Works Cited
1. Center for Nutrition Policy and Promotion. (2006). About Us. Retrieved July 26, 2006. Available at: http://www.cnpp.usda.gov/AboutUs.htm
2. United States Department of Agriculture. (2005). About USDA. Retrieved July 7, 2006. http://www.cprl.ars.usda.gov/about_usda_ars.htm
3. Agriculture Information Bulletin No. 1999. Dietary recommendations and how they have changed over time. (AIB750) May 1999, p. 484. http://www.ers.usda.gov/publications/aib750/aib750b.pdf
4. Food Insight. (1999). We've Come a Long Way: Looking Back at Food Guides and Recommendations. Retrieved July 12, 2006. Available at: http://www.ific.org/foodinsight/1999/nd/foodguidefi699.cfm
5. Squires, Sally. (2005). Food Pyramid Gets New Look. Retrieved July 8, 2006. Available at: http://www.washingtonpost.com/wp-dyn/articles/A693-2005Apr19.html
6. Inside the Pyramid. Retrieved July 20, 2006. Available at: http://www.mypyramid.gov/pyramid/oils_why.html
7. Kuczmarski R.J. and Flegal K.M. (2000). Criteria for definition of overweight in transition: background and recommendations for the United States. American Journal of Clinical Nutrition Vol. 72(5): 1074-1081.
8. Tavelli S, Beerman K., Shultz J.E. and Heiss C. (1998). Sources of error and nutritional adequacy of the food guide pyramid. J Am Coll Health 47(2): 77-82.
9. Brown L. and Hsing-Kuan C. (2000). A food display assignment and handling food models improves accuracy of college students' estimates of food portions. JADA 100(9): 1063-1064.
10. Levitsky D.A., Halbmaier C.A. and Mrdjenovic G. (2004). The freshman weight gain: a model for the study of the epidemic of obesity. Int J Obes Relat Metab Disord. 28 (11): 1435.
11. Center for Nutrition Policy and Promotion. (2000). Healthy Eating Index. Retrieved July 20, 2006. Available at: http://www.cnpp.usda.gov/HealthyEatingIndex.htm
12. Ezzati M., Martin H., Skjold S., Vander Hoorn S. and Murray C.J. (2006). Trends in national and state-level obesity in the USA after correction for self-report bias: analysis of health surveys. J R Soc Med. 99 (5): 250-7
13. Truesdale K.P. and Stevens J. (2006). Do the obese know they are obese? Experimental Biology 2006, FASEB Journal 20 (March 7): A1313.
14. Caccamese SM, Kolodner K and Wright SM. (2002). Comparing patient and physician perception of weight status with body mass index. Am J Med. 112(8): 662-6.
15. Joffe, David. (2006). The Role of Media in Childhood Obesity. Retrieved July 10, 2006. Available at: http://www.diabetesincontrol.com/modules.php?name=News&file=print&sid=2091
16. Center For Disease Control And Prevention. (2006). Deaths-Leading Causes. Retrieved July 31, 2006. Available at: http://www.cdc.gov/nchs/fastats/lcod.htm
Appendix A
Please take a moment to fill out this survey. It is completely confidential, so please try to be honest when answering all of the questions. Your response will become a part of a study examining the diet and health attitudes of students at HCCC. Please circle your answer or answers in the questions below unless directed otherwise:
Age: ________ Sex: ________ Height: ________ Weight: _________ Do you take a daily vitamin? YES NO Do you exercise regularly? YES NO Which exercise(s)? Walking Running Swimming Aerobic Machines Weight training
Other: __________________________________________________________________
On average, how many days do you exercise per week? 1 2 3 4 5 6 7 How long is each session? 10-20 minutes 20-30 minutes 30-60 minutes 60+ minutes What is your perceived body type? Underweight Normal weight Overweight Are you currently on a diet? YES NO If YES, which diet? Atkins South Beach Weight Watchers
Other: ________________
Do you normally eat breakfast? YES NO If YES, what do you typically eat? ___________________________________________ Do you normally eat lunch? YES NO If YES, what do you typically eat? ___________________________________________ Which do you normally have: a "sit-down" dinner OR a "dinner-on-the-go" What is a typical dinner that you eat? _________________________________________ On average, how many times do you snack throughout the day? 0 1 2 3 4 5 6+ What do you typically have for a snack? _______________________________________ On average, how many times per week do you eat fast food? 0 1-2 3-4 5-6 7+ What is this a picture of? _______________________________
How many cups of fruit are recommended each day? ½ ¾ 1 1.5 2 2.5 3 On average, how many do you think you eat each day? ½ ¾ 1 1.5 2 2.5 3 How many cups of vegetables are recommended each day? ½ ¾ 1 1.5 2 2.5 3 On average, how many do you think you eat each day? ½ ¾ 1 1.5 2 2.5 3 How many cups of dairy are recommended each day? ½ ¾ 1 1.5 2 2.5 3 On average, how many do you think you eat each day? ½ ¾ 1 1.5 2 2.5 3 How many ounces of meat are recommended each day? 1 2 3 4 5 6 7 On average, how many do you think you eat each day? 1 2 3 4 5 6 7 How many ounces of grains are recommended each day? 2 3 4 5 6 7 8 On average, how many do you think you eat each day? 2 3 4 5 6 7 8
|
