The Other-Race Effect and Facial Identification
Greta Schlick and Jessica Rossbach
College of St. Catherine
Abstract
Thirty-nine college students participated in an experiment that involved the other-race effect and facial identification. Of these participants, 33 were White/Caucasian, 4 were Black/African American and 2 were Hispanic/Hispanic American. This experiment was broken up into two segments. In the first section, students were shown 24 pictures of four different racial groups. There were 6 pictures of Hispanic/Hispanic American individuals, 6 Asian/Asian American individuals, 6 Black/African American individuals, and 6 White/Caucasian individuals. Each picture was shown for two seconds. In the second section, the students were shown 48 pictures one at a time and asked to identify on a response sheet whether or not they had seen that specific face before. They were marked as either old or new faces. Each of these pictures was shown for four seconds. The other-race effect states that people are more likely to remember and recognize faces of individuals who are their own race rather than people who are of another race (Tanaka , Kiefer, & Bukach, 2004). Although the other-race effect has been demonstrated in many studies in the past 30 years, our results did not support it. The Caucasians and Hispanics participants responded with the most correct answers to Asians. The Black participants correctly responded to Whites more often than the other three races including their own.
The Other-Race Effect and Facial Identification
The other-race effect is a well-known issue that has been performed both in the laboratory and in real-life situations. Many criminal prosecutions involve a member of one race attempting to identify a perpetrator who is of another race. The main idea of the other-race effect is that “Eyewitnesses are less likely to misidentify someone of their own race than they are to misidentify someone of another race” (Wells & Olson, 2001 , p. 230). For example, if you are Caucasian, you are more likely to misidentify someone who is Asian rather than if they were Caucasian. An explanation for this is the theory that “They all look alike,” which states that within a person ’s race they recognize the diversity among members, but when it is a member of another racial group the person does not see any real differences. In other words, they see more similarity (Ferguson, Rhodes, Lee, & Sririam , 2001). “They all look alike to me” is what many White/Caucasians say when they are faced with members of other races (Sporer, 2001a). An example of this would be that to White/Caucasians all Asians look alike and to Asians all White/Caucasians look alike. Now this is not necessarily true for everyone.
A person’s interactions and experience with other ethnicities also influences whether they display a strong other-race effect or a small one. For example, there is a difference between growing up in North Minneapolis, Minnesota or in Edina, Minnesota. In North Minneapolis, a Caucasian would have a lot of interaction and experiences with other ethnic groups, whereas, a person coming from Edina would not have the same type of interaction with other ethnic groups. The interactions with any other race would be infrequent because there is not a lot of diversity among ethnic groups in the population make-up of Edina. Sporer, Malpass, and Koehnken (1996) said that the more interaction that an individual has with other ethnic groups than their own, the more likely they are able to correctly identify members of other ethnicity groups. The probability of these individuals misidentifying a suspect of another ethnic group is lower when they have more interaction with the particular ethnicity that is being identified.
Tied into this idea , Wells and Olson (2001) wrote that members of one race might be more willing to choose someone from a line up if they are a member from another race than a member of their own. This situation has not actually been tested, but is very interesting to think about. For example, when having to identify an individual as being guilty for a crime, a White/Caucasian may be more willing to say a person of another race is guilty before they are willing to convict someone of their own race. The same may be true in reverse. It may be more likely that a person of another race is unsure as to who their perpetrator is, therefore, they choose a White/Caucasian individual rather than someone of their own race.
One idea that you might be wondering about the other-race effect, is whether or not an individual’s racial bias affect s the outcome of the other-race effect? Actually there have also been studies conducted on this point. According to Sporer, Malpass, and Koehnken, (1996), generalized attitudes about other races or ethnicities do not seem to have an effect on their memory performance. This indicates that a person’s attitudes do not interfere with facial encoding when dealing with the other-race effect.
To begin to understand the other-race effect, there are models that help clarify what the underlying mechanism may be that cause people to cluster members outside their race into a generic group that is not distinctive. For example, the first model is the multidimensional face space model. This model attempts to explain why it is that faces of one’s own race are more readily available to be recalled than the face of someone of another race. This model states that faces of other races are often confused with each other because in a person’s memory they tend to be close together (Wells & Olson, 2001). In other words, one’s memory spreads its own race widely making many connections, whereas members of other races are clustered together. By having more interaction with members of other racial groups, you allow yourself to spread these images and form more connections in memory as you do with own-race memories.
Another model in the other-race effect is Sporer (2001b) in-group/out-group model. Sporer claims that when you first encounter a face, the first step is acknowledging what ethnicity this person is; this is termed social perception. When you see an out-group face, your first step is to trigger an out-group cue. You then categorize this individual as to ethnicity. This is the first reaction to how members from an in-group or out-group are different from one another. This model implies that persons, once they have recognized a person as in the out-group, no longer concern themselves with encoding and storing the face because it is not as important to them as their own group or the in-group.
There are also some concerns about the other-race effect. Our concerns begin with the fact that the other-race effect has “many possible effect sizes depending on the presence or absence of currently known (and some as-of-yet unknown) moderators” (Wells & Olson, 2001, 232). First, an issue is the photographs that you are showing to an individual. There could be many problems with the selections. How many photographs are you showing? Is there a large quantity of each group of individuals when comparing to other-races? For example, are two pictures used of a male or female from each race? Or, are 5 photographs used from each race? The pictures that are used should be the same size and there should be enough pictures where the task is not an easy one. Care needs to be taken to be sure not too many pictures are used; otherwise, how are the participants ever supposed to recognize any faces? Another important point is the types of pictures used. Pictures of individuals should be typical of a race. They should not stand out by having distinctive features. For example, tattoos, crazy hair, large facial features, or vibrant backgrounds would be distinctive features that may individualize a person. Individuals should not stand out from one another.
Another concern is using “race as an experimental variable” (Wells & Olson, 2001, p. 234). What guidelines are being used to determine race? Which categories describe all persons? For example, “Anthropologists…do not consider Hispanics or Mexican Americans to be a different race from White Americans” (Wells & Olson, 2001, p. 234). In our experiment, we used the top four ethnic groups in terms of population as our ethnic groups. This was according to the US Census Bureau. Another thing to consider is that not every person is just one ethnicity. Some people may be Hispanic and African American.
People question whether the other-race effect is a part of our social world or really a memory task. Is it because of society and therefore our interactions with others that we think “They all look alike?”
In their analysis of 77 mistaken eyewitness identifications Scheck, Neufeld, and Dwyers reported that 35% were cases of White victim-witness misidentifying Black suspects, whereas only 28% were cases of White victims misidentifying White suspects. (Wells & Olson, 2001, p. 231)
This statement is crucial because most crimes that are committed toward white individuals have white perpetrators. Yet still there is a large population of misidentified blacks who are now being exonerated thanks to DNA analysis.
When considering the other-race effect one question that has been raised is to know at what age children begin producing this effect. Does it occur immediately after birth that they recognize other-race faces better than own-race faces or is that something that develops? Sangrigoli (2004) performed a study on this very idea. The experiment involved people ages 6-20 years old. He found that the other-race effect did not appear until the age of seven. This means that after the age of seven the children who were Caucasian were better able to identify other Caucasians than they were Asian individuals. The findings suggest it is a developmental learning process that distorts the perceptual space which enhances recognition of distinctive characteristics relative to one’s own-race faces (Furl, Phillips, & O’ Toole, 2002). Thus children along with adults eventually recognize their own-race faces more accurately than cross - race faces (Pezdek, Blandon-Gitlin, & Moore, 2003).
In testing the validity of the other-race effect, we are using the “old-new” paradigm. Here, the participants are shown an array of photographs. Then the participants are shown these faces along with other faces and presented one at a time. They are tested to see whether or not they are able to recognize this individual as a person they have seen before or not. This is the nature of the experiment in this research.
Method
Participants
The participants in this study were 39 undergraduate female students from the College of St. Catherine. Of these individuals 33 were White/Caucasian, 4 were Black/African American, and 2 were Hispanic/Hispanic American. They all participated in their General Biology class setting. The study was conducted during normal class hours. They performed this experiment together at their desks.
Materials
The materials needed for this experiment include a pen and/or pencil, response sheet, laptop with Microsoft PowerPoint software, and a projector so the participants were able to view the PowerPoint presentation. The response sheet was two pages in length, stapled in the top-left corner. At the top of the response sheet the participants were asked to record their race/ethnicity and then rate the amount of interaction that they had had with White/Caucasians, Black/African Americans, Hispanic/Hispanic Americans, and Asian/Asian Americans. When rating the amount of interaction that the participants have with these ethnic groups, they are to circle a 1, 3, or 5. A 1 indicates that they rarely interact with members of this ethnicity, maybe once a month. A 3 means that they interact with members of this ethnicity group occasionally, at least once a week. A 5 indicates that they interact with members of this ethnicity on a regular basis, at least daily.
The response sheet is then numbered 1 through 64 with the choices of “OLD” or “NEW.” The participant is to circle whether or not they feel they are looking at a new or old face. They selected “OLD” if they have seen this face before or “NEW” was chosen if it was a face they did not recall seeing. Although there were 64 spaces for a response of “OLD” or “NEW,” there were only 48 pictures. The point of this is to keep participants from trying to have the same number of “OLD” and “NEW” responses thinking that there was an even number of each. This also kept the responses more accurate as to what the participant was thinking.
There are two different portions of this experiment to allow for time to pass as would in a real-life situation. In the first part of this experiment, the participants were shown 24 of the 48 photographs on a PowerPoint presentation. There were 6 White/Caucasians, 6 Black/African Americans, 6 Hispanic/Americans, and 6 Asian/Americans. These photographs were placed in random order and shown to the participants.
For the second part of this experiment all 48 photographs were shown to the participants in a random order. This time there were photographs of 12 White/Caucasians, 12 Black/African Americans, 12 Hispanic/Hispanic Americans, and 12 Asian/Asian Americans. Of these 12 photographs of each ethnicity 6 photographs from each ethnicity were from the first PowerPoint presentation. These photographs were taken from www.mugshots.com, www.facethejury.com, and www.hotornot.com. All of the photographs were of males with no distinctive features that separated them from other members of their race/ethnicity. For example, there were not any pictures of males with tattoos, bald head, long hair, or vibrant backgrounds. The photographs used were of males who looked typical. Each finished photograph was approximately 4.25 x 4.00 inches. These photographs were cropped and either enlarged or reduced from their original size in order to make all of the pictures approximately the same size. The photographs were then imported into a PowerPoint presentation and placed in a random order.
Procedures
The first part of this experiment was performed at the beginning of the General Biology class hour. This experiment began by the experimenters instructing the participants to watch the PowerPoint presentation and pay attention to the different photographs shown. Each photograph was shown for two seconds. There were 24 photographs, so this portion of the experiment took approximately 48 seconds to perform. Before the photographs were shown to the participants, the lights in the classroom were turned off so the participants could see each photograph more clearly.
Approximately 1 hour and 13 minutes later the second portion of the experiment was conducted. The response sheets were passed out to each participant and they were instructed to fill out the top portion of the response sheet. This is where the participants recorded their race/ethnicity and rated the amount of interaction they had with various ethnic groups. The lights were again turned off so the PowerPoint was more easily viewed. Then the experimenters informed the participants that they would be shown a group of pictures each individually. The participants’ job was to decide whether or not this face is one that they have seen before or not. After they had reached this decision, the participants circled either “OLD” or “NEW.” The participants circled “OLD” if this was a picture that they recognized seeing before or “NEW” if this is a picture that they did not recognize previously seeing. Each picture was shown for 4 seconds this time. There were a total of 48 pictures, 24 old and 24 new. So, the second part of this experiment took approximately 3 minutes and 12 seconds. There was more time given to the second part of this experiment in between each picture so that the participants had enough time to write down each of their responses.
After the experiment was completed, the participants were told to leave the response sheets on their desks and the experimenters would collect them. The experimenters corrected the response sheets at a later time by placing checkmarks over the number the respondents got wrong and placing the race of the individual in the photograph next to the number.
Results
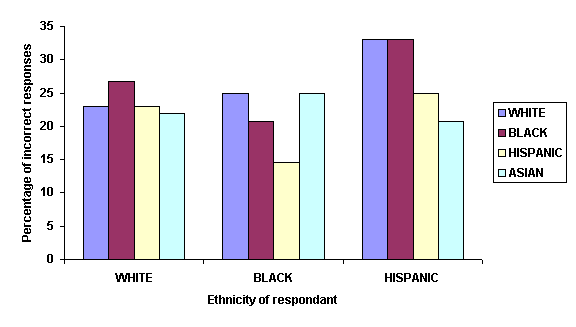
Our results differed from what we had originally expected. Hispanic/Hispanic Americans were correct in their responses 71.9% of the time. When looking at individuals who were white in the photographs, the Hispanic/Hispanic Americans together incorrectly responded to 8 out of 24 white photographs—33 % of the time. The same was true for individuals in the photographs who were Black/African American. When looking at photographs of Asian/Asian Americans, the Hispanics answered incorrectly 5 times out of 24—20.8 % of the time. When Hispanic/Hispanic Americans were shown other Hispanic/Hispanic Americans, they responded incorrectly 6 times out of 24 photographs—25 % of the time. This shows that the Hispanic/Hispanic American individuals incorrectly identified more White/Caucasians and Black African Americans than the other ethnicities. However, they scored better on the Asian/Asian Americans than on their own ethnic group.
The Black/African American participants answered correctly 78.6% of the time. When looking at photographs of White/Caucasian males there were 12 incorrect responses out of a total of 48—25 % of the time. When looking at photographs of Hispanic/Hispanic Americans there were 7 incorrect responses out of 48--4.6 % of the time. When looking at Asian/Asian American photographs, there were 12 out of 48 incorrect responses—25 % of the time. This was the same as their identification for the White/Caucasians. When the Black/African American participants were shown other Black/African American photographs, they incorrectly responded to 10 out of 48 total responses. This means 20.8% of the Black/African American photographs were answered incorrectly. When looking at this data you can see that the Black/African American participants scored incorrectly more often when looking at White/Caucasian and Asian/Asian American photographs. However, like the Hispanic/Hispanic American participants, they did not answer correctly most of the time within their own ethnic group. They answered more photographs correctly when shown photos of Hispanic/Hispanic Americans than when they were shown Black/African American photos.
The White/Caucasian individuals in this study correctly responded to 76.3% of the photographs in this study. When looking at Black/African American photographs, the White/Caucasian participants answered incorrectly 106 out of 396 times—26.8 % of the time. When looking at photographs of Hispanic/Hispanic Americans, they responded incorrectly 91 out of 396 times—23 % of the time. When looking at photos of Asian/Asian Americans, they incorrectly responded 87 out of 396 times—23.7% of the time. When looking at other White/Caucasian photos, they incorrectly identified 91 out of 396 photos. This was the same as for the Hispanic/Hispanic Americans. The White/Caucasian participants had more correct responses when looking at photographs of other Asian/Asian Americans than they did by looking at their own ethnic group. They indicated more incorrect responses when shown Black/African American photographs than any other ethnic group.
Figure 1 below shows the results that were given above. It allows one to compare the ethnic groups and the number of incorrect responses they had made compared to other ethnic groups.
Figure1. Percentage of incorrect responses made by different ethnicities.
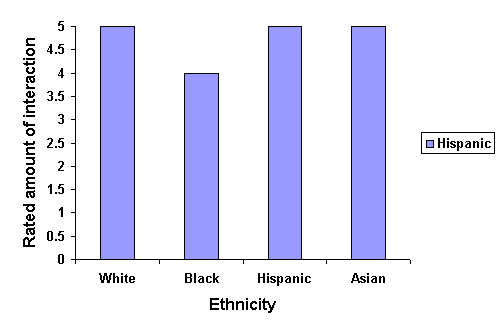
Another area introduced earlier is the idea that the amount of interaction that an individual has with another race than their own depends on how well they perform in this experiment. If you are Black/African American and you go to school at the College of St. Catherine, as these participants do, you are more likely to be able to identify a White/Caucasian individual. The reason for this is that most of the students who go to the College of St. Catherine are White/Caucasian. Therefore, you would interact with members of this ethnic group more often. In this experiment, the participants were asked to rate their average interaction with members of their own and other ethnicities. The findings matched our expectations and at the same time were very interesting. Participants were asked to rate their interaction: 1 if they rarely interact with this ethnic group, 3 if they occasionally interact with this ethnic group, or 5 if they frequently interact with this ethnic group. The Hispanic/Hispanic American participants on average claim their interaction with White/Caucasians is frequent, a 5. Their interaction with Black/African Americans is not so high, averaging a 4. The interaction that they have with other Hispanic/Hispanic Americans is a 5 and Asian/Asian Americans is a 5 as well. Overall, the average interaction that the Hispanic/Hispanic American participants have with members of other ethnic groups is 4.667.
Figure 2. Interaction that Hispanic/Hispanic Americans have with members of other races.
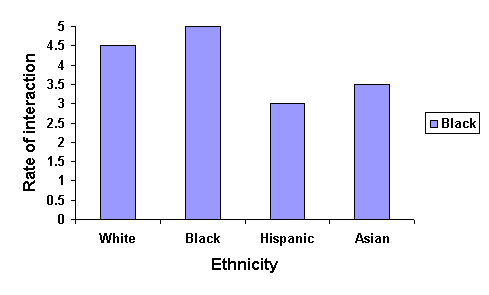
Participants who were Black/African American on average indicated that they interact with White/Caucasian individuals for a 4.5 rating. So, fairly frequent interaction with this ethnic group. They claimed they interact with other Black/African Americans frequently, a 5. The interaction that they have with Hispanic/Hispanic Americans is a 3. The interaction they have with Asian/Asian Americans is a 3.5 meaning pretty occasionally. On average, the amount of interaction the Black/African American participants have with members of other ethnic groups is 3.667. This is a big drop in interaction levels when compared to the Hispanic/Hispanic American participants’ interactions with other races.
Figure 3. Interaction that Black/African Americans have with members of other races.
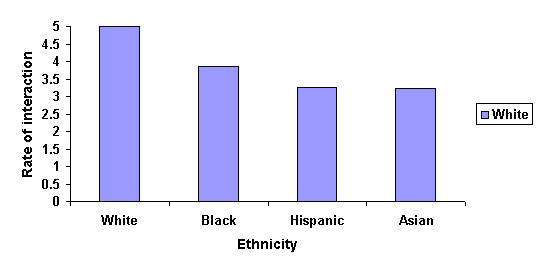
Lastly, the White/Caucasian participants rated their interaction with other White/Caucasian individuals as a 5. They rated their interaction with Black/African Americans as 3.85, so that is occasionally. Their interaction with Hispanic/Hispanic Americans was 3.27 and with Asian/Asian Americans were 3.24. On average the White/Caucasian participants interact with members of other races 3.453. So, occasionally they interact with other racial groups.
Figure 4. Interaction White/Caucasians have with members of other ethnic groups.
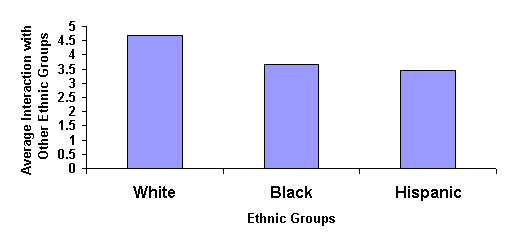
Overall, you will see that the White/Caucasian individuals claim that they interact with other ethnic groups less than Black/African Americans and Hispanic/Hispanic Americans. Where Hispanic/Hispanic American participants frequently interact with races other than their own, the White/Caucasian group interacts the least with other races, only occasionally. It is also interesting to note that every individual rated their interaction with their own ethnicity a 5.
Figure 5. The average interaction that an ethnic group has with other ethnic groups.
While analyzing the relationship between interaction and percentage of errors that were made among the three groups, we found no relationship at all. Whites stated their interaction level was the highest with other whites, but they had the highest percentage correct for Asian faces. Blacks also stated they interacted the most with their own race, but their lowest error percentage was with Hispanics. The Hispanics had the highest interaction level with 5 for everyone except for Blacks at a 4. They most correctly responded to Asian faces and most incorrectly responded to both White and Blacks.
While analyzing our data there were a few interesting points that we noticed. For example, nobody got number 23 wrong. He was the white male shown below in Figure 6.
Figure 6. White male number 23.
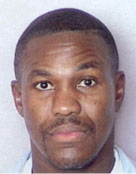
It seemed that a lot of people had trouble remembering numbers 32, 46, and 48 or Figures 6, 7 and 8. Number 32 was a black male, 46 was a white male, and 48 was an Asian male. They are shown below. We believe they were highly similar to other faces and were probably in the middle of the presentation, which is often not memorable to participants.
Figure 7. Black male number 32.
Figure 8. White male number 46.
Figure 9. Hispanic male number 48.
Discussion
Our data do not support our original prediction of outcomes. We thought the Caucasians would show the largest other-race effect because the College of St. Catherine is predominantly white, which suggests that a white person’s daily interactions would most likely be with white people, not giving them experience and interactions with people from other races. Our data could be skewed because almost all of our participants were Caucasian, which meant the subject’s ethnicities were not balanced. However, the College of St. Catherine students may also have more multi-cultural interactions than we had taken into account while forming our experiment.
The other-race effect is often greatly influenced by the amount of interactions and/or experience a person has with that specific ethnic group. The more an individual associates with other races the more preconceived notions can be dispelled and stereotypes lessened. Much of the other-race effect we believe stems from quick decision-making without higher process on accuracy of the face. If persons broaden their daily personal interactions they will focus more closely in examining other-race faces, which can then start to reverse the robust effect. An example is if you make a conscious effort to have interactions with people outside of your race you then will start to notice the uniqueness of their faces.
There are several different models or hypotheses that help to understand the underlying cause of the other-race effect. The Configural-feature hypothesis states that individuals gain expertise on their own race because they process the face as a whole, whereas, people from other races are viewed by their features rather than by their whole face. For many objects or images, breaking them down into features or parts does not cause you to lose the image as a whole. But for faces, the whole face is more meaningful in recognition and encoding than knowing certain features. An example would be a white person seeing the image of a black person they most likely would remember the person had a large, wide nose and full lips but would not encode the face as a whole in their mind. However, if the same white person saw another white person, they would fit the features into the face as a whole to create a complete facial image. Likewise, when African Americans look at Caucasians, they pay attention more to position and shape as cues (Lindsay, Jack & Christian, 1991).
Another model, the multidimensional face space model, illustrates a second possible reason why people can more quickly identify people of their race as opposed to other races. This idea holds that people have different amounts of space available in their mind to represent different racial faces other than there own. When black persons view faces of multiple black people they would store each face individually noting any distinct features as well as the face as a whole. However, if that same black individual were to view numerous Hispanic faces they would clump many of the faces together and use a few prototypic face to compare whether it was recognizable or not.
Wells and Olson (2001) noted concerns about the method that we used to perform our experiment. The “OLD” or “NEW” option, have participants seen this face before or not? They reported that many researchers claim this is a good method to use, but they feel that it can end up being an experiment of mistaken identifications. It would be a mistaken identification when the new faces are marked as old faces. This creates a false alarm of mistaken identities.
We were surprised as to how many identities people were answering incorrectly. It makes us wonder if this would still be the case if they knew the person in the photograph could have charges pressed against them if they are found to be an “OLD” face. Would there be many more “NEW” answers because they were unsure as to whether or not they had seen the face before?
References
Ferguson, D. P., Rhodes, G., Lee, K., & Sririam, N. (2001). “They all look alike to me”: Prejudice and cross-race face recognition. British Journal of Psychology, 92, 567-577.
Furl, N., Phillips, J. P., & O’Toole, A. J. (2002). Face recognition algorithms and the other-race effect: computational mechanisms for a developmental contact hypothesis. Cognitive Science, 26, 797-815.
Lindsay, D. S., Jack, P. C., & Christian, M. A. (1991). Other-race face perception. Journal of Applied Psychology, 76, 587-589.
Pezdek, K., Blandon-Gitlin, I., & Moore, C. (2003). Children's face recognition memory: More evidence for the cross - race effect . Journal of Applied Psychology, 88 , 760-763.
Sangrigoli, S. (2004). Effect of visual experience on face processing: A developmental study of inversion and non-native effects. Developmental Science, 7, 74-87.
Sporer, S. L. (2001a). Recognizing faces of other ethnic groups: An integration of theories. Psychology, Public Policy and Law, 7, 36-97.
Sporer, S. L. (2001b). The Cross-Race Effect: Beyond Recognition of faces in the Laboratory. Psychology, Public Policy and Law, 7, 170-200.
Sporer, S. L., Malpass, R. S., & Koehnken, G. (1996). Psychological issues in eyewitness identification. New Jersey: Lawrence Erlbaum Associates, Inc., Publishers.
Tanaka, J. W., Kiefer, M., & Bukach, C. M., (2004). A holistic account of the own-race effect in face recognition: evidence from a cross-cultural study. Cognition, 39, B1-B9.
Wells, G. L., & Olson E. A. (2001). The other-race effect in eyewitness identification: What do we do about it? Psychology, Public Policy, and Law, 7, 230-246
|
